


Strategic analysis frameworks are essential tools for understanding competitive landscapes. Among these, Michael Porter’s Five Forces model remains a cornerstone of business education and corporate strategy. However, applying this framework correctly requires nuance. Many students approach the Five Forces with a checklist mentality, leading to superficial insights rather than actionable intelligence.
This guide examines the specific errors frequently observed in academic and early professional settings. By identifying these pitfalls, you can refine your analytical rigor. The goal is not to memorize the forces, but to understand the underlying economic logic that drives industry profitability.
Understanding the Framework Basics ⚙️
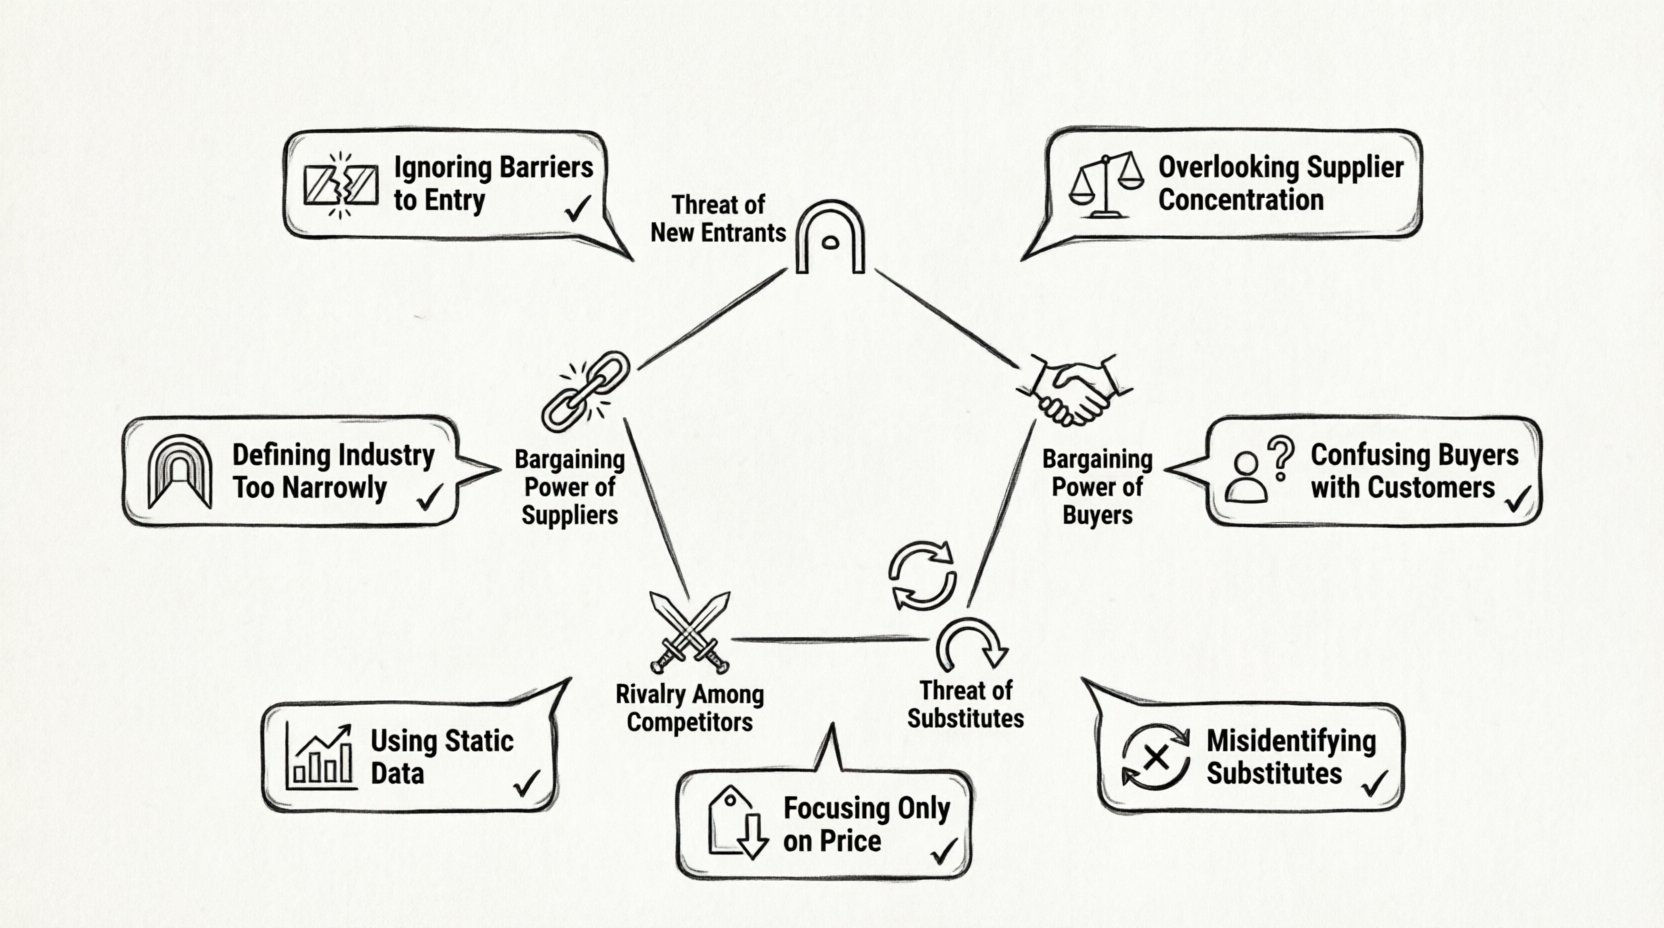
Porter’s model assesses the intensity of competition and profitability potential within an industry. It looks beyond direct competitors to examine the broader ecosystem. The five forces are:
- Threat of New Entrants: How easy is it for new players to enter?
- Bargaining Power of Suppliers: Can suppliers drive up prices?
- Bargaining Power of Buyers: Can customers drive down prices?
- Threat of Substitute Products: Are there alternative solutions?
- Rivalry Among Existing Competitors: How intense is the current fight?
When used effectively, this analysis reveals where value is captured and where it leaks. When used poorly, it produces generic statements that apply to every industry.
Mistake 1: Ignoring Barriers to Entry 🚧
One of the most common oversights involves the assessment of entry barriers. Students often assume that if a company is profitable, barriers must be low, or conversely, that high profits imply high barriers. This logic is flawed.
Why This Happens
There is a tendency to look only at financial capital. Students might think, “Anyone can start a coffee shop,” and therefore conclude barriers are low. They fail to account for regulatory hurdles, proprietary technology, or customer switching costs.
How to Avoid It
Expand your definition of barriers. Consider the following dimensions:
- Regulatory Licenses: Does the industry require specific government approvals? (e.g., telecommunications, pharmaceuticals)
- Economies of Scale: Does a new entrant need massive volume to compete on cost?
- Brand Loyalty: Is it difficult to convince customers to switch from an established brand?
- Access to Distribution: Are shelf space or channels controlled by incumbents?
When analyzing an industry, ask: “What specific asset would stop a well-funded competitor from entering tomorrow?” If the answer is vague, your analysis lacks depth.
Mistake 2: Overlooking Supplier Concentration ⚖️
The power of suppliers is often underestimated. Students frequently categorize suppliers as a commodity and assume buyers always hold the leverage. In reality, supplier power shifts based on market concentration.
Why This Happens
The focus tends to be on the end-user rather than the supply chain. It is easy to see the customer, but harder to map the upstream dependencies. Additionally, there is a bias toward the “big company” perspective, assuming the firm under analysis is the dominant player.
How to Avoid It
Map the supply chain explicitly. Look for these indicators of supplier power:
- Supplier Concentration: Are there only a few suppliers for a critical component?
- Switching Costs: Is it expensive to change suppliers? (e.g., retraining staff, new machinery)
- Threat of Forward Integration: Can the supplier become a competitor?
- Uniqueness of Input: Is the input differentiated or a commodity?
Consider the airline industry. While passengers have choices, the market for aircraft is dominated by two manufacturers. This concentration gives suppliers significant leverage, regardless of how many airlines exist.
Mistake 3: Confusing Buyers with Customers 👥
In many B2B contexts, the buyer and the user are different entities. A common error is analyzing the end-user’s preferences when the actual purchasing decision lies with a procurement department or a government entity.
Why This Happens
There is a natural empathy for the end-user. Marketing students often focus on consumer psychology. However, economic power lies with the entity writing the check. If that entity faces high switching costs or has limited alternatives, they hold the power.
How to Avoid It
Identify the decision-making unit. Ask these questions:
- Volume of Purchase: Does the buyer purchase in large quantities?
- Information Availability: Does the buyer know the market price better than the seller?
- Threat of Backward Integration: Can the buyer make the product themselves?
- Price Sensitivity: Is the input a significant portion of the buyer’s total cost?
For example, in the hospital equipment market, the patient is the user, but the hospital administration is the buyer. The hospital has significant power to negotiate prices, even if the patient has no choice.
Mistake 4: Misidentifying Substitutes 🔄
This is arguably the most critical conceptual error. Students often confuse substitutes with direct competitors. A substitute satisfies the same need in a different way. A competitor satisfies the same need in the same way.
Why This Happens
It is easier to compare price points of similar products. It is harder to quantify the threat of a completely different solution. There is a tendency to define the industry too narrowly (e.g., “the soda industry”) rather than broadly (e.g., “the beverage industry”).
How to Avoid It
Focus on the function, not the form. Ask: “What problem is the customer trying to solve?”
- Cost-Benefit Analysis: Is the substitute cheaper or more convenient?
- Performance Trade-off: Does the substitute work less well but cost much less?
- Technological Convergence: Is technology blurring the lines between industries? (e.g., smartphones replacing cameras, GPS, and MP3 players)
Consider the taxi industry. The direct competitor is another taxi company. The substitute is public transit, walking, or ride-sharing apps. Analyzing only the taxi-to-taxi rivalry misses the existential threat of ride-sharing.
Mistake 5: Focusing Solely on Price Competition 🏷️
When assessing rivalry among existing competitors, students often default to price wars. They assume competition is only about who can sell cheaper. This ignores differentiation, capacity utilization, and exit barriers.
Why This Happens
Price is the most visible metric. It is easy to see a discount sale. It is harder to see a strategic shift in brand positioning or a capacity expansion plan.
How to Avoid It
Look for structural drivers of rivalry:
- Number of Competitors: Are there many small players or a few large ones?
- Industry Growth: Is the market growing slowly? (Slow growth forces firms to fight for market share)
- Fixed Costs: Are there high fixed costs that pressure firms to fill capacity?
- Diversity of Competitors: Do competitors have different strategies and origins?
- Exit Barriers: Is it hard to leave the industry? (e.g., specialized assets, emotional attachments, government restrictions)
If exit barriers are high, firms will fight fiercely to stay, even at the cost of profitability. This creates intense rivalry that price analysis alone cannot explain.
Table: Common Pitfalls vs. Strategic Fixes 📋
| Force | Common Mistake | Strategic Fix |
|---|---|---|
| New Entrants | Assume capital is the only barrier | Check regulations, switching costs, and distribution access |
| Suppliers | Ignore supplier concentration | Map the supply chain and assess forward integration threats |
| Buyers | Confuse user with purchaser | Identify the decision-making unit and their leverage |
| Substitutes | Focus on direct competitors | Analyze functional alternatives and customer needs |
| Rivalry | Focus only on price wars | Evaluate exit barriers, growth rates, and cost structures |
Mistake 6: Using Static Data in a Dynamic Market 📉
Porter’s model is often treated as a snapshot. Students use data from a single year to make long-term strategic assumptions. Industries evolve rapidly. Technology, regulations, and consumer habits shift the forces constantly.
Why This Happens
Academic assignments often require specific data points. This encourages a “plug and play” approach where data is inserted into the model without considering trends.
How to Avoid It
Conduct a trend analysis. Do not rely on a single year’s financial report. Instead:
- Review Historical Trends: How have supplier margins changed over the last 5 years?
- Identify Catalysts: Is there new legislation coming that will change entry barriers?
- Monitor Innovation: Is a new technology emerging that alters the substitute threat?
A static analysis might say an industry is stable. A dynamic analysis might reveal that a technological shift is about to render the current business model obsolete.
Mistake 7: Defining the Industry Too Narrowly 🎯
Another frequent error is setting the boundaries of the analysis too tightly. If you analyze the “desktop computer market,” you miss the threat of tablets. If you analyze the “hotel industry,” you miss Airbnb.
Why This Happens
It is comfortable to stick to standard industry classifications (e.g., NAICS codes). These codes are useful for data retrieval but often lag behind market reality.
How to Avoid It
Define the industry based on customer needs, not product categories. Ask:
- Substitution Scope: What else could the customer buy to solve this problem?
- Competition for Wallet Share: What other categories are competing for the same disposable income?
- Regulatory Boundaries: Are there regulations that artificially separate the market?
By widening the scope, you capture the true competitive pressure. You might find that a company is not competing with a direct rival, but with a completely different sector.
Data Quality and Source Verification 🔍
The output of any analysis is only as good as the input. New strategy students often rely on secondary sources that are outdated or biased. This leads to conclusions that do not match ground reality.
Best Practices for Research
- Cross-Reference Sources: Do not rely on a single annual report. Compare with industry associations and competitor filings.
- Check Dates: Ensure all financial data and market statistics are current. Old data can mislead regarding current forces.
- Primary Research: Where possible, look for interview data, customer reviews, or supply chain reports. These provide qualitative context that numbers miss.
- Assumption Testing: Explicitly list the assumptions you are making. If you assume “low switching costs,” state that. This allows others to challenge your logic.
The Interaction of Forces 🔗
Finally, a common failure is treating the five forces in isolation. They interact. A change in one force often alters another.
For instance, if the threat of new entrants decreases due to higher barriers, existing competitors may face less pressure. This could allow them to increase prices, which in turn increases the bargaining power of suppliers (if suppliers can now charge more without fear of buyers switching).
Alternatively, a rise in buyer power might force companies to innovate. This innovation could increase the threat of substitution if the innovation opens the door to new competitors.
Systemic Thinking Approach
When writing your analysis, include a section on interdependencies. Ask:
- How does supplier power affect rivalry?
- How does the threat of entry impact buyer power?
- Do substitutes constrain the ability of competitors to raise prices?
Recognizing these connections moves the analysis from a checklist exercise to a holistic strategic view.
Contextual Blindspots 🌍
Strategic frameworks are often developed in specific contexts, typically the United States or Europe. Applying them to emerging markets or different cultural contexts without adjustment leads to errors.
Key Contextual Factors
- Government Intervention: In some regions, the state plays a major role in supply chains or pricing.
- Family Ownership: In many Asian and Latin American markets, family conglomerates dominate, altering power dynamics.
- Informal Economy: In developing markets, a significant portion of competition may be informal, which is invisible in standard data.
Always adjust the weighting of each force based on the specific geographic and cultural context of the industry.
Final Considerations for Strategic Accuracy ✅
Porter’s Five Forces is a powerful lens, but it is not a crystal ball. It helps structure thinking about industry profitability. To use it effectively, you must avoid the traps of superficiality, static thinking, and narrow definition.
By focusing on the underlying economic drivers rather than surface-level symptoms, you create analysis that holds up to scrutiny. Remember that the goal is to understand value creation and capture, not just to fill out a diagram.
Continuously challenge your own assumptions. If a force seems weak, look harder for evidence. If a force seems strong, verify if there are mitigating factors. This critical approach separates competent strategy work from average reporting.
Keep your data fresh, your scope broad, and your focus on the customer’s underlying need. This discipline will yield insights that are actionable and robust.
Apply these lessons to your next case study. The difference between a good grade and a great strategy often lies in the depth of this analysis.

