Understanding how a shopper moves through your digital storefront is the difference between a casual visitor and a loyal advocate. Customer journey mapping is not just a buzzword; it is a strategic framework used to visualize the entire experience a person has with your brand. By charting every interaction, from the first ad click to the post-purchase unboxing, you gain clarity on where friction exists and where delight can be amplified.
For online stores, this process is critical. Unlike physical retail, digital interactions leave a trail of data, but they can also feel impersonal. A well-executed map reveals the hidden paths customers take, the questions they ask, and the doubts they harbor before hitting checkout. This guide provides a deep dive into creating effective maps, complete with real-world examples and actionable strategies.
🧭 The Anatomy of a Digital Purchase Path
Before diving into specific examples, it is necessary to understand the standard stages of the customer lifecycle. Every journey follows a general progression, though the duration and intensity of each stage vary by product type and price point.
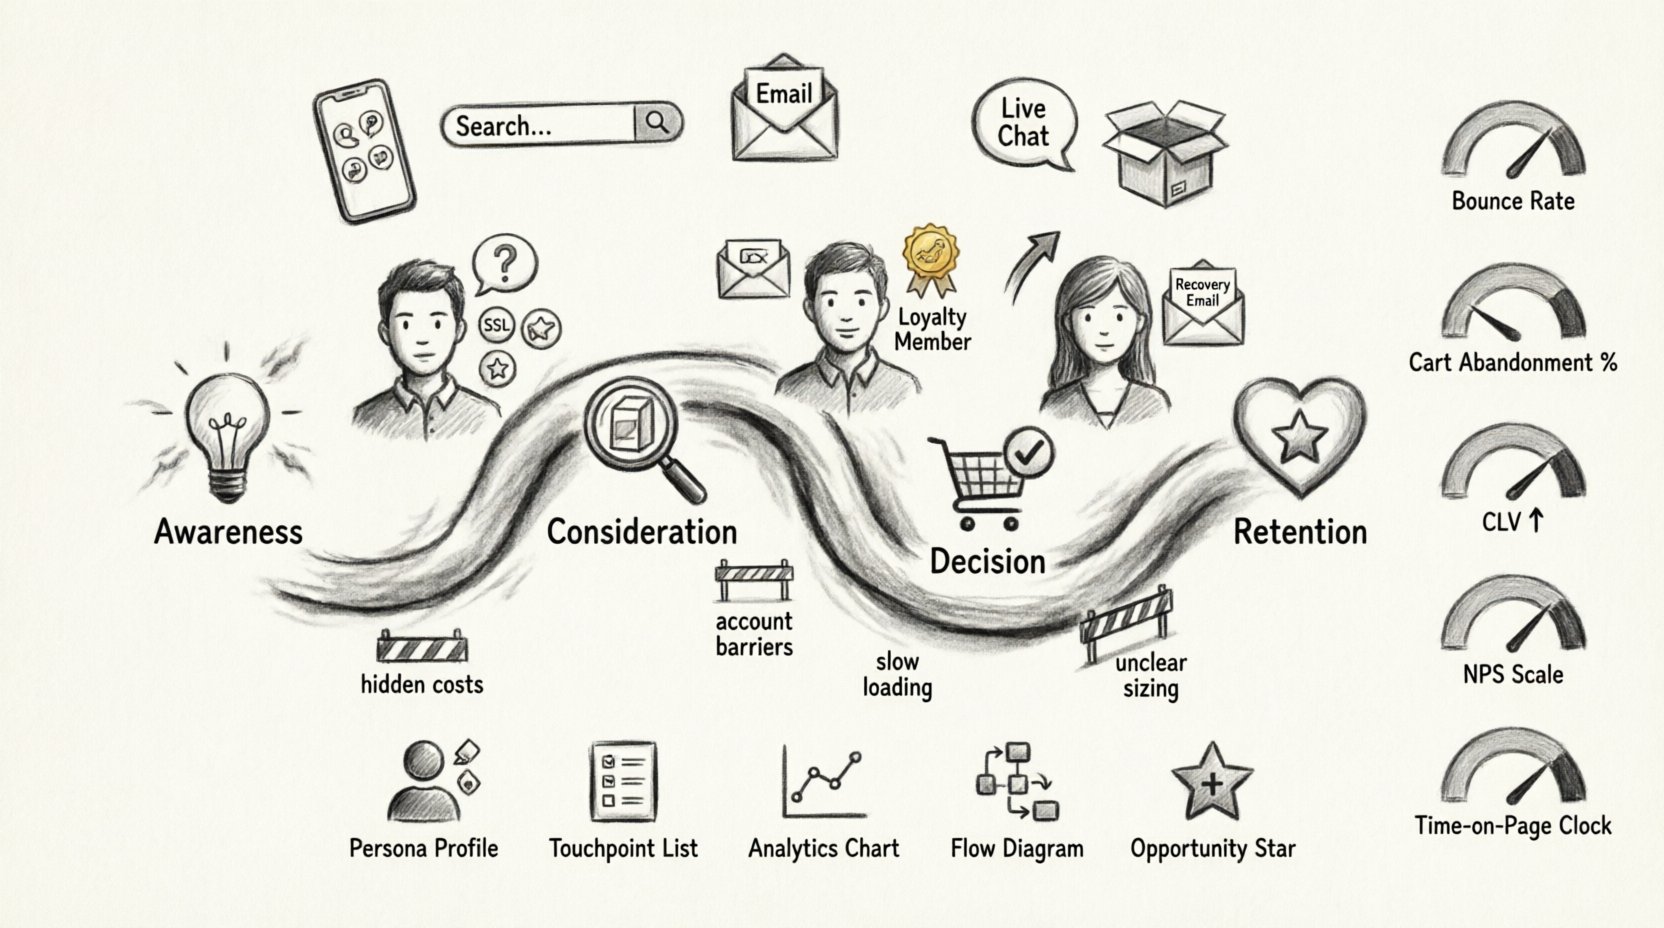
- Awareness: The moment the customer realizes they have a need. This is often triggered by a search query, a social media post, or a word-of-mouth recommendation.
- Consideration: The customer evaluates your store against competitors. They read reviews, compare prices, and look at product specifications.
- Decision: The intent to purchase solidifies. They add items to the cart and proceed to the checkout flow.
- Retention: The relationship continues after the sale. This includes delivery, support, and repeat purchase incentives.
Mapping these stages allows you to align your marketing and operational efforts with the customer’s mindset at each specific moment.
🔍 Scenario 1: The First-Time Shopper
The first-time visitor represents a high-opportunity, high-risk segment. They do not know your brand voice, shipping policies, or return procedures. Their journey is defined by trust-building.
Key Touchpoints
- Social Media Ad: A visually compelling image that highlights the product benefit.
- Landing Page: Must load quickly and clearly state the value proposition within the first three seconds.
- Trust Signals: Badges, reviews, and secure payment icons must be visible above the fold.
- Customer Support Chat: A live option to answer immediate questions without hesitation.
Common Friction Points
- Hidden Costs: Unexpected shipping fees appearing at the end of checkout cause immediate abandonment.
- Account Creation: Forcing a user to register before purchasing creates unnecessary barriers.
- Unclear Sizing: Lack of size guides leads to hesitation and fear of returns.
Mapping Strategy
To optimize this journey, the focus must be on transparency. Ensure shipping costs are estimated early. Offer guest checkout options. Display social proof prominently on product pages. The goal is to reduce cognitive load and build confidence rapidly.
🔍 Scenario 2: The Returning Customer
A returning customer already trusts the brand. Their journey is about convenience and personalization. They do not need to be convinced of quality; they need to be reminded of relevance.
Key Touchpoints
- Email Newsletter: Personalized recommendations based on past purchase history.
- Homepage Banner: “Welcome back” messaging or “Complete your look” suggestions.
- Account Dashboard: Easy access to order history and reorder functionality.
- Loyalty Program: Points accumulation or tier status updates.
Common Friction Points
- Broken Links: Returning users expect a smooth experience; broken paths damage trust quickly.
- Generic Messaging: Sending the same blast email to everyone ignores their specific preferences.
- Slow Loading: Returning users value speed over discovery. The site must perform flawlessly.
Mapping Strategy
For this segment, efficiency is key. Implement one-click reordering. Segment email lists to ensure relevance. Use data to anticipate needs before the customer articulates them. The map should highlight moments where the experience feels seamless versus moments where it feels repetitive.
🔍 Scenario 3: The Cart Abandoner
This is the most critical moment in the e-commerce funnel. A customer has demonstrated high intent but left without paying. Understanding why they left requires a granular look at the checkout journey.
Key Touchpoints
- Cart Page: Clear summary of items, total cost, and estimated delivery date.
- Checkout Form: Address fields, payment details, and shipping method selection.
- Abandonment Email: A timely reminder sent hours after the drop-off.
- Retargeting Ads: Display ads showing the exact items left behind.
Common Friction Points
- Account Requirements: Asking users to create a password during checkout.
- Payment Options: Lack of preferred payment methods (e.g., digital wallets, buy now pay later).
- Security Concerns: Missing SSL indicators or unclear return policies.
Mapping Strategy
Optimize the checkout flow for speed. Reduce the number of form fields. Enable guest checkout. Use exit-intent popups to offer assistance or a small discount. The map should track exactly where the user drops off to pinpoint the technical or psychological blocker.
📱 Mapping Touchpoints Across Channels
Customers rarely stay on one channel. They might see an ad on Instagram, search on Google, read a review on a third-party site, and buy on your mobile app. A comprehensive map connects these dots.
| Channel | Interaction Type | Customer Goal | Business Goal |
|---|---|---|---|
| Social Media | Scrolling, Clicking, Sharing | Entertainment, Inspiration | Awareness, Traffic |
| Search Engine | Querying, Clicking SERP | Information, Solution | Intent Capture |
| Opening, Clicking, Purchasing | Updates, Offers | Retention, Conversion | |
| Customer Support | Chat, Ticket, Call | Resolution, Clarity | Satisfaction, Trust |
| Physical Mail | Unboxing, Card Reading | Experience, Delight | Brand Loyalty |
When mapping, you must ensure consistency across these columns. If the tone on social media is playful, the email should match. If the support team is formal, the chat widget should reflect that. Inconsistency confuses the user and erodes brand identity.
⚠️ Identifying Friction Points
Friction is the resistance a customer feels when trying to achieve a goal. In e-commerce, friction equals lost revenue. Identifying these points requires both quantitative data and qualitative feedback.
- Technical Friction: Slow page loads, broken images, mobile responsiveness issues.
- Psychological Friction: Fear of making the wrong choice, confusion over pricing, anxiety about security.
- Process Friction: Too many clicks, complicated forms, confusing navigation.
To find these, analyze heatmaps to see where users click and scroll. Review session recordings to watch real behavior. Conduct surveys asking users to rate the difficulty of their last purchase.
🛠️ Building the Map Step-by-Step
Creating a journey map is a collaborative effort. It requires input from marketing, sales, customer support, and product teams. Follow this structured approach to ensure accuracy.
1. Define Personas
Create detailed profiles of your typical buyers. Give them names, jobs, and motivations. One persona might be a bargain hunter looking for deals, while another is a quality seeker prioritizing durability. Map different journeys for different personas.
2. List All Touchpoints
Brainstorm every single place the customer interacts with your brand. Be exhaustive. Include email receipts, packaging, and even post-purchase follow-up calls.
3. Gather Data
Collect analytics on traffic sources, conversion rates, and drop-off points. Supplement this with customer feedback and support logs. Data tells you what is happening; feedback tells you why.
4. Visualize the Flow
Draw the path. Use swimlanes to show different departments responsible for each stage. Mark emotional highs and lows. This visual representation helps stakeholders understand the customer experience intuitively.
5. Identify Opportunities
Look for the low points on the emotional graph. These are your priority fixes. If customers are angry at the shipping cost, find a way to integrate it earlier or offer free shipping thresholds.
📊 Metrics That Matter
You cannot improve what you do not measure. Tracking the right KPIs ensures your mapping efforts translate to business growth. Focus on metrics that reflect the journey, not just the final sale.
| Metric | Definition | Target Focus |
|---|---|---|
| Bounce Rate | Percentage of visitors who leave after viewing one page | Awareness Stage |
| Cart Abandonment Rate | Percentage of shoppers who add items but do not buy | Decision Stage |
| Customer Lifetime Value | Total revenue expected from a single customer account | Retention Stage |
| Net Promoter Score | Measure of customer loyalty and likelihood to recommend | Post-Purchase Stage |
| Time on Page | Duration a user spends on a specific content piece | Consideration Stage |
Regularly review these numbers. A spike in bounce rate on the product page indicates a content or technical issue. A drop in NPS suggests a problem with product quality or delivery.
🔄 Keeping the Map Current
A customer journey map is not a one-time project. Behaviors change. Trends shift. New competitors enter the market. To remain effective, the map must evolve.
- Schedule Quarterly Reviews: Set aside time to update the map with new data.
- Monitor Seasonal Shifts: Holiday shopping behaves differently than summer shopping. Adjust expectations accordingly.
- Watch for Tech Changes: New browser features or payment methods may alter how users interact.
- Listen to Feedback: Customer complaints often reveal gaps in the map that data missed.
💡 Actionable Takeaways
Start small. Do not try to map every single user in the universe. Pick one persona and one key path. Document the current state. Identify the top three friction points. Implement fixes. Measure the impact. Repeat.
Invest in tools that allow you to track user behavior without being intrusive. Ensure your data privacy practices are compliant and transparent. Trust is the foundation of the journey.
Remember that the goal is not just to sell, but to serve. When a customer feels understood and supported, they become a partner in your growth. This shift in perspective changes how you design every page, email, and interaction.
By systematically applying these examples and strategies, you transform a chaotic digital environment into a streamlined path to purchase. The result is higher conversion rates, lower support costs, and a brand that customers genuinely enjoy engaging with.
Begin your mapping process today. Your customers will thank you, and your bottom line will reflect the effort.

