Agile methodologies rely heavily on the ability to forecast outcomes. Without a clear understanding of how much work a team can complete in a given timeframe, planning becomes guesswork. Estimating velocity is the mechanism used to transform historical performance data into actionable forecasts. This process allows stakeholders and teams to set realistic expectations regarding delivery dates and scope.
Velocity is not merely a metric; it is a reflection of a team’s rhythm. It captures the collective output of individuals working together toward a shared goal. When managed correctly, it provides a stable foundation for sprint planning and release tracking. This guide explores the mechanics of calculating velocity, interpreting the data, and applying it to predict project delivery timelines.
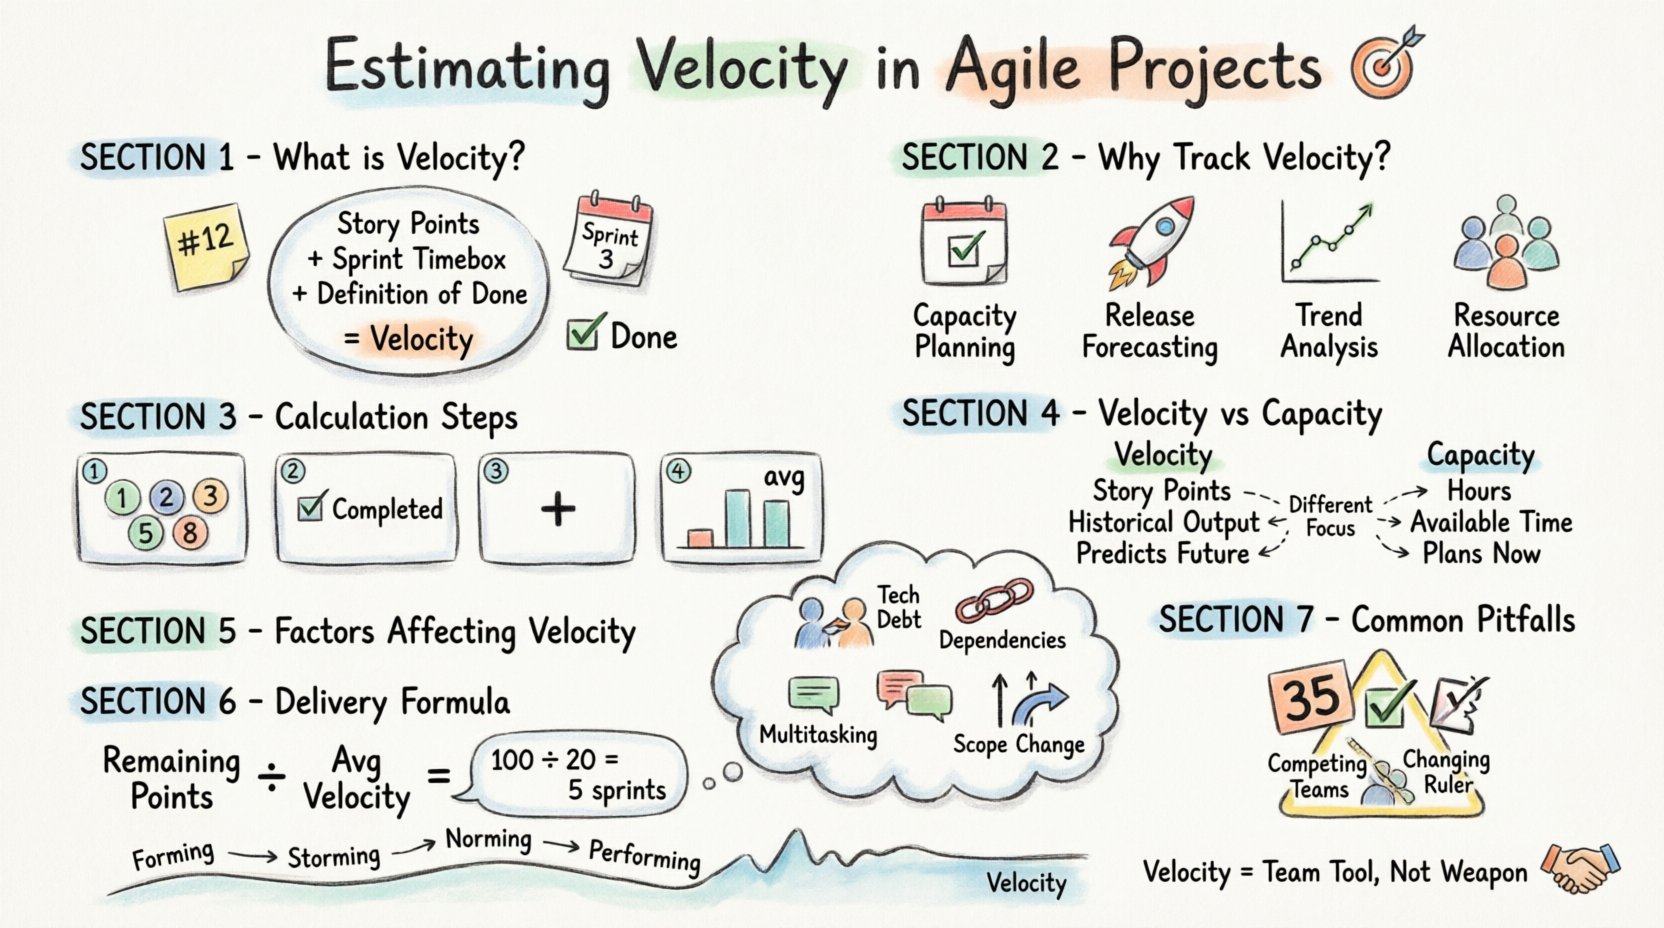
What Exactly is Velocity? 🎯
Velocity is a measure of work completed during a specific period, typically a sprint. It is calculated by summing the values assigned to user stories or tasks that reach the definition of done. These values are often expressed in story points, though other units like ideal hours can be used.
The core principle is consistency. A team must use the same estimation technique across all sprints to ensure the data remains comparable. If the team switches between story points and hours, the velocity metric loses its predictive power.
- Unit of Measure: Typically story points representing complexity, effort, and risk.
- Timebox: Usually one sprint, lasting two to four weeks.
- Completion Criteria: Only work that meets the definition of done counts toward velocity.
It is important to understand what velocity is not. It is not a performance benchmark used to compare one team against another. Teams operate with different compositions, skill sets, and domain knowledge. Comparing velocity between teams leads to inaccurate conclusions and potential morale issues.
Why Estimate Velocity? The Strategic Value 💡
Organizations adopt agile practices to improve responsiveness and predictability. Velocity estimation directly supports the latter. By analyzing past performance, teams can answer critical questions about when a feature will be ready or how many sprints are required for a release.
Here are the primary benefits of tracking velocity:
- Capacity Planning: Helps product owners understand how much work fits into a sprint backlog.
- Release Forecasting: Allows stakeholders to estimate a completion date for a defined scope of work.
- Trend Analysis: Reveals whether a team is improving, stabilizing, or struggling over time.
- Resource Allocation: Assists management in making informed decisions about staffing and budgeting.
Without this data, delivery dates are often based on optimism rather than evidence. Velocity grounds the planning process in reality.
The Calculation Process 🔢
Calculating velocity is straightforward, but the integrity of the result depends on the quality of the data. The process involves recording the points for every completed item at the end of each sprint.
Step 1: Define Story Points
Before tracking velocity, the team must agree on a standard for estimation. Story points are relative units. A story rated 3 is significantly harder than one rated 1, but not necessarily three times harder. Teams often use the Fibonacci sequence (1, 2, 3, 5, 8, 13) to reflect increasing uncertainty as numbers grow.
Step 2: Identify Completed Work
At the end of the sprint, review the backlog. Only items that fully satisfy the acceptance criteria count. If a story is 90% complete, it contributes zero points to velocity. Partial work does not generate value for the customer and should not be counted.
Step 3: Sum the Points
Add up the points for all completed items. This sum is the velocity for that specific sprint.
Step 4: Average Over Time
A single sprint’s velocity is volatile. New sprints often see fluctuations due to learning curves or holidays. To get a reliable figure, calculate the average velocity over the last three to five sprints.
Velocity vs. Capacity: Understanding the Difference ⚖️
While velocity measures output, capacity measures availability. Confusing the two can lead to overcommitment. Capacity is the total time available for work, considering holidays, meetings, and other obligations.
| Aspect | Velocity | Capacity |
|---|---|---|
| Definition | Work actually completed in a sprint. | Time available to work in a sprint. |
| Unit | Story Points | Hours or Days |
| Purpose | Predicting future output based on history. | Planning immediate workload. |
| Stability | Stabilizes over time. | Changes every sprint based on schedule. |
When planning a sprint, start with capacity to ensure everyone is available. Then, map that availability against historical velocity to ensure the team does not commit to more points than they can handle.
Factors Influencing Velocity 📉
Velocity is not a constant. It fluctuates based on several internal and external factors. Understanding these variables helps in adjusting forecasts accurately.
- Team Composition: If a key developer leaves or a new member joins, velocity will shift. New members require time to ramp up, often reducing initial output.
- Technical Debt: High technical debt slows down development. Refactoring work consumes capacity that could otherwise be used for new features.
- External Dependencies: Waiting on third-party APIs or other teams creates bottlenecks that reduce effective velocity.
- Context Switching: Frequent interruptions and multitasking degrade focus and reduce the rate of completion.
- Scope Changes: Adding mid-sprint requirements disrupts flow and lowers the final count.
Predicting Delivery Dates 🗓️
Once a stable velocity is established, it becomes a tool for forecasting. This is particularly useful for release planning. The process involves dividing the remaining work by the average velocity.
The Formula
To estimate the number of sprints needed:
- Identify Remaining Work: Sum the points of all items in the product backlog.
- Determine Average Velocity: Use the average from the last three to five sprints.
- Calculate Sprints: Divide remaining work by average velocity.
Example:
- Total Points Remaining: 100
- Average Velocity: 20 points per sprint
- Estimated Sprints: 100 / 20 = 5 sprints
This calculation provides a baseline. It should be adjusted for known risks. If a major dependency is pending, add buffer time to the estimate.
Common Pitfalls in Velocity Tracking 🚫
Teams often misuse velocity, which invalidates the data. Being aware of these traps helps maintain data integrity.
- Padding Estimates: Inflation of story points to make velocity look higher. This creates false confidence.
- Counting Partial Work: Including incomplete stories to boost numbers. This skews future planning.
- Ignoring Definition of Done: Marking items as done without satisfying all criteria. This leads to technical debt accumulation.
- Comparing Teams: Using velocity to rank teams. This encourages gaming the system rather than honest reporting.
- Changing Estimation Standards: Shifting from story points to hours without recalibrating. Consistency is key.
Adjusting for Variance and Risk 🛡️
Even with historical data, uncertainty remains. Agile planning must account for variance. A reliable forecast includes a margin for error.
Confidence Intervals
Instead of stating a single date, provide a range. If the calculation suggests five sprints, consider stating four to six sprints. This range acknowledges the natural fluctuation in team performance.
Buffer Allocation
Deduct a percentage of capacity for unplanned work. A common practice is to reserve 20% of the sprint for bugs, support tickets, or unexpected changes. This ensures the team does not overcommit to new features.
| Scenario | Adjustment | Impact on Forecast |
|---|---|---|
| New Team Member | Reduce velocity by 30% | Increases sprint count |
| High Technical Debt | Reduce velocity by 20% | Increases sprint count |
| Complex Domain | Reduce velocity by 15% | Increases sprint count |
| Stable Environment | Maintain current velocity | Standard forecast |
Team Dynamics and Maturity 🤝
Velocity evolves as a team matures. Early in a project, velocity is likely low as the team learns the product and establishes workflow. This is known as the forming and storming stages.
- Forming: Low velocity. Focus is on setting up processes.
- Storming: Fluctuating velocity. Conflicts and adjustments occur.
- Norming: Velocity stabilizes. Team finds a rhythm.
- Performing: High, consistent velocity. The team is efficient.
Managers should not expect peak velocity immediately. Patience is required during the initial phases. Pushing for high numbers too soon can damage quality and team cohesion.
Data Integrity and Transparency 🔍
For velocity to be useful, the data must be accurate. Transparency is essential. Every team member should understand how points are assigned and how velocity is calculated.
Regular retrospectives provide a forum to discuss velocity trends. If velocity drops, the team should investigate the cause. Is it a lack of clarity? Technical issues? External blockers? Addressing the root cause is more valuable than simply trying to increase the number.
Long-term Planning Implications 🚀
Velocity supports long-term roadmapping. Product owners can visualize the backlog against the team’s capacity. This allows for prioritization based on value and delivery feasibility.
If the roadmap requires a feature set that exceeds the current velocity, the options are clear:
- Reduce the scope of the release.
- Increase team capacity by adding resources.
- Extend the timeline for delivery.
- Improve efficiency by removing waste.
This clarity prevents the promise of impossible deadlines. It aligns stakeholder expectations with operational reality.
Continuous Improvement 🔄
The goal is not to maximize velocity at all costs. The goal is sustainable delivery. A velocity that is artificially high often leads to burnout and quality degradation. A sustainable pace ensures long-term productivity.
Monitor velocity over months, not just weeks. Look for trends. A downward trend might indicate a need for training or process changes. An upward trend might indicate the team is optimizing their workflow. Use these insights to drive continuous improvement.
Final Considerations 📝
Estimating velocity is a disciplined practice that transforms intuition into data. It requires honesty, consistency, and a focus on value delivery. When implemented correctly, it becomes the backbone of reliable agile planning.
Teams should treat velocity as a tool for themselves, not a weapon for management. It empowers the team to make commitments they can keep. It builds trust with stakeholders by demonstrating a clear understanding of delivery capabilities.
Remember that velocity is a team metric, not an individual one. It belongs to the group. Celebrate the stability of the metric, not just the spikes. Consistency is the hallmark of a mature agile practice. By focusing on the process rather than the number, teams can achieve predictable and sustainable outcomes.
The journey toward accurate estimation is ongoing. Regular reviews and adjustments ensure the metric remains relevant. As the product and team evolve, so too will the velocity. Embrace the data, learn from the trends, and use the insights to navigate the complexities of software delivery.

