


Customer journey mapping is a strategic tool used to visualize every interaction a person has with a brand or organization. It goes beyond simple transaction tracking. It captures the emotional and psychological landscape of the experience. A high-impact map does more than just list steps. It reveals the why behind the what. It connects data to human behavior. When executed correctly, this artifact becomes the blueprint for experience design.
Creating a map that drives actual change requires specific structural elements. Without these components, the output remains a decorative chart rather than an actionable strategy. The following guide details the seven critical pillars necessary for building a map that delivers value. These elements ensure clarity, accuracy, and utility for teams across the organization.
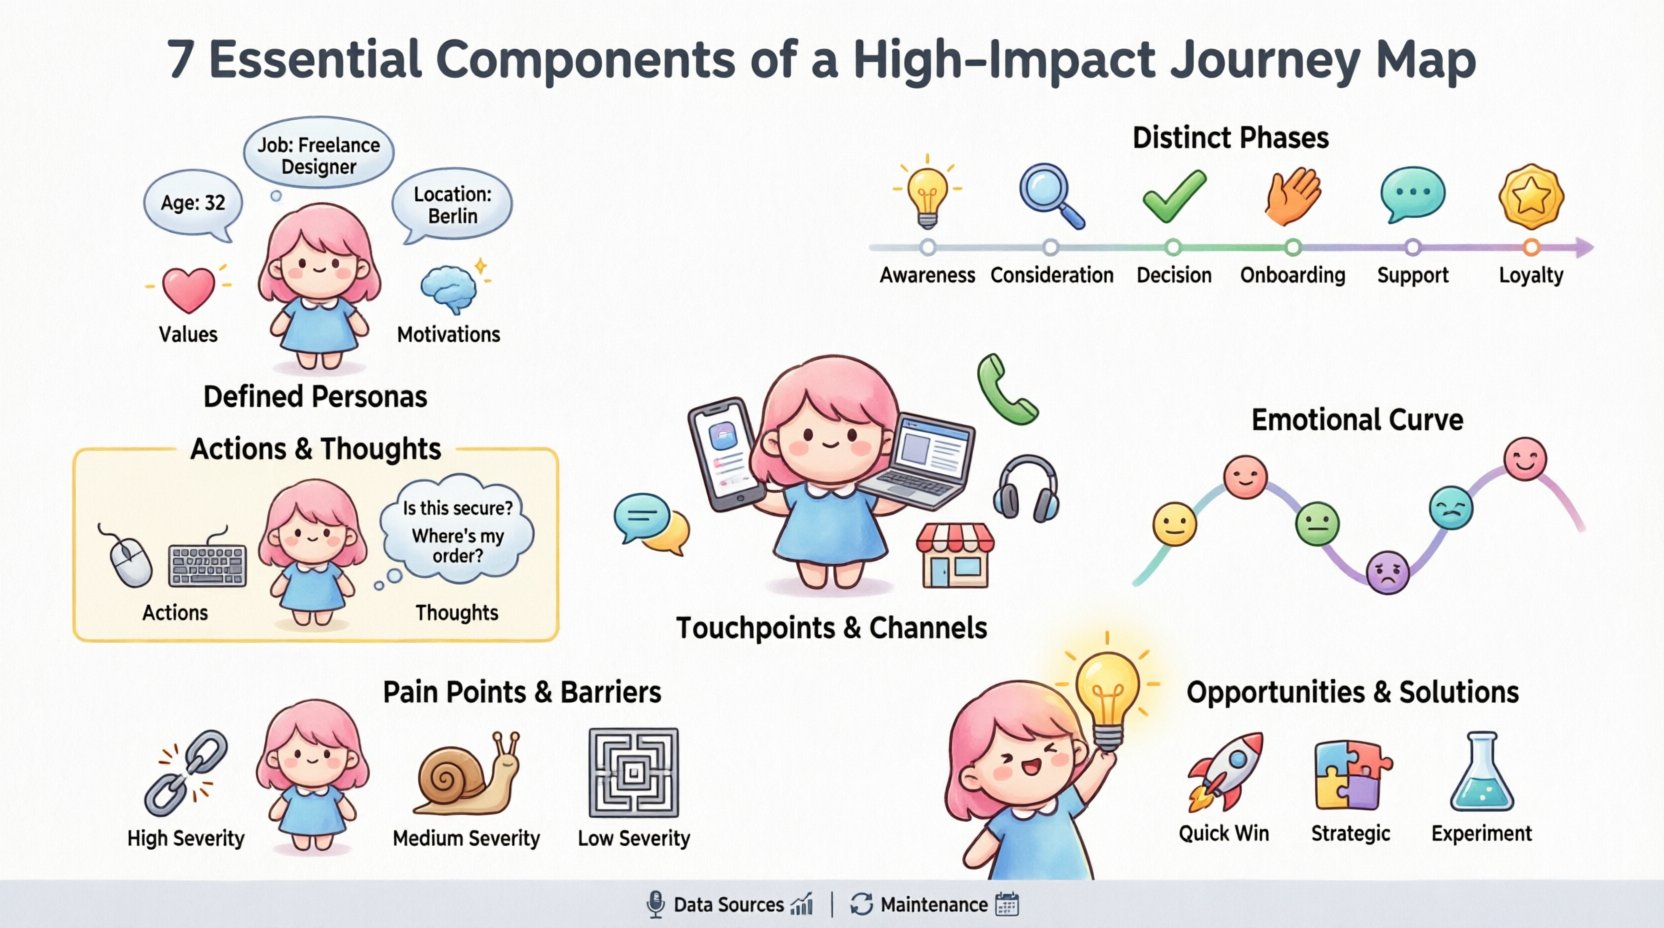
1. Defined Personas and Audience Segments 🧑💼
A journey map is never generic. It must represent a specific type of user. Starting with a broad audience dilutes insights. You cannot map the experience of everyone at once. You need to segment your audience based on shared needs, behaviors, and goals. This is where the persona comes into play.
- Demographics: Age, location, job title, and income provide context.
- Psychographics: Values, motivations, fears, and aspirations drive decision-making.
- Tech Savviness: Understanding digital comfort levels affects channel expectations.
- Current Pain Points: What problems are they trying to solve right now?
Without a clear persona, the map becomes a collection of assumptions. Stakeholders may disagree on who the map represents. This leads to conflicting priorities. By defining the persona upfront, you align the team on who is being served. This section should include a brief narrative about the individual. Give them a name and a background story. This humanizes the data. It reminds designers and developers that real people are navigating these paths.
2. Distinct Phases and Stages 📅
Customer experiences are not random events. They follow a logical progression. This progression is the backbone of the journey map. Breaking the experience into phases helps teams understand the lifecycle of the relationship. Common frameworks include awareness, consideration, purchase, retention, and advocacy. However, industry specifics may alter these names.
- Awareness: The customer realizes they have a need.
- Consideration: They research options and compare solutions.
- Decision: They choose a vendor or product.
- Onboarding: They begin using the service or product.
- Support: They seek help when issues arise.
- Loyalty: They become repeat customers or promoters.
Each phase requires distinct actions and emotional states. The transition between phases is often where friction occurs. For example, moving from consideration to decision often involves a significant commitment. The map must clearly delineate these boundaries. This allows teams to focus on specific interventions for each stage. It prevents the tendency to treat a pre-sale inquiry the same as a post-sale support ticket. Clarity in staging ensures that the right resources are applied at the right time.
3. Comprehensive Touchpoints and Channels 📱
Touchpoints are the moments of contact between the customer and the brand. These can be digital, physical, or human-mediated. A high-impact map captures the full spectrum of interactions. It is easy to focus only on the website or the app. However, the experience is omnichannel. A customer might see an ad on social media, visit a physical store, call support, and then log in to a portal.
| Channel Type | Examples | Key Consideration |
|---|---|---|
| Digital | Website, App, Email, Social Media | Consistency of UI and messaging |
| Physical | Store, Office, Kiosk, Event | Environment and staff interaction |
| Communication | Phone, Chat, Video Call | Wait times and tone of voice |
| Product | The item itself, Packaging, Documentation | Usability and quality |
Mapping these channels ensures you do not create silos. If the website promises one thing but the sales team says another, the journey breaks. The map highlights where the handoff occurs between channels. For instance, if a customer starts a chat on mobile and continues on desktop, the context must transfer. Identifying every touchpoint allows you to audit the consistency of the brand voice and visual identity. It also reveals gaps where a touchpoint is missing. Perhaps customers expect a text message update after shipping, but none is sent. Filling these gaps closes the loop on the experience.
4. Detailed Customer Actions and Thoughts 🤔
What is the customer actually doing? This is the operational layer of the map. It lists the specific steps taken to move through the stages. Alongside actions, you must capture what the customer is thinking. Actions are observable. Thoughts are inferred from research, interviews, or analytics. Together, they provide a complete picture of the workflow.
- Actions: Clicking a button, filling a form, scanning a QR code, speaking to an agent.
- Thoughts: “Is this secure?”, “Where is my order?”, “Is this the right price?”, “Do they understand me?”
Aligning actions with thoughts is critical. If a customer clicks “Buy Now” (Action) but worries about hidden fees (Thought), the conversion will likely fail. The map makes this friction visible. It shows the cognitive load required at each step. You can identify moments where the user has to work too hard to understand the interface. This section should be written from the user’s perspective, using “I” statements. For example, “I am looking for pricing” instead of “User navigates to pricing page.” This keeps the focus on the human experience rather than the system architecture.
5. Emotional Curve and Sentiment 😊😫
Data tells you what happened. Emotion tells you how it felt. This component is often the most overlooked but the most valuable. It tracks the customer’s sentiment throughout the journey. This is visualized as a curve or line graph running parallel to the stages. Positive emotions indicate moments of delight. Negative emotions highlight areas of frustration.
- High Points: Moments of success, speed, or personalization.
- Low Points: Moments of error, delay, or confusion.
- Neutral Points: Routine tasks that require no emotional engagement.
Understanding the emotional arc helps prioritize improvements. A small friction point in a high-emotion phase can have a disproportionate negative impact. For example, a login error during checkout (high stress) is worse than a slow loading page during research (low stress). The goal is to smooth out the dips. You want to avoid the “valley of despair” where frustration peaks. Researching this data often involves sentiment analysis on support tickets or direct customer interviews. It adds a layer of empathy that raw metrics cannot provide. When stakeholders see a dip in the curve, they understand the human cost of a technical issue.
6. Pain Points and Barriers 🚧
This section identifies the specific obstacles that stop the customer from achieving their goal. Pain points can be functional, emotional, or environmental. They are the friction that slows down the journey or stops it entirely. Identifying them is the first step toward removal.
- Functional Barriers: Broken links, slow load times, complex forms.
- Informational Barriers: Lack of clarity, missing instructions, confusing terminology.
- Emotional Barriers: Fear of commitment, distrust of the brand, anxiety about privacy.
- Process Barriers: Too many approval steps, long wait times, manual handoffs.
Each pain point should be tagged with severity and frequency. A rare issue might not warrant immediate attention. A frequent, high-severity issue should be the top priority. You should also categorize the source of the pain. Is it a technology issue? A policy issue? A people issue? This categorization directs the fix to the right department. For example, if the pain point is “Wait time on phone,” the fix lies with operations or staffing, not software development. Clear identification prevents the tendency to throw technology at a process problem.
7. Opportunities and Solutions 💡
A map is not complete without the output. This component translates the insights into actionable strategies. Every pain point should have a corresponding opportunity. Every negative emotional spike should have a plan to fix it. This turns the map from a diagnostic tool into a roadmap for improvement.
- Quick Wins: Changes that can be implemented immediately for high impact.
- Strategic Initiatives: Long-term projects that require resources and planning.
- Experimental Ideas: Low-risk tests to validate new approaches.
This section often includes a proposal for the next steps. It assigns ownership. Who is responsible for fixing this specific barrier? When is it due? It links the map directly to the product backlog or operational plan. Without this, the map sits on a shelf. It becomes a report rather than a tool. The opportunities must be realistic. They should align with business goals and customer needs. This ensures that the journey improvements also drive business value. It bridges the gap between customer desires and company capabilities.
Data Sources and Validation 📊
Building a map based on assumptions is risky. High-impact maps rely on robust data. You need to triangulate information from multiple sources to ensure accuracy. Relying on a single survey can skew results. A mix of qualitative and quantitative data provides the most complete view.
Qualitative Data
This includes customer interviews, focus groups, and usability testing. It answers the “why” behind the behavior. It provides the narrative context. Listen to what people say in their own words. Record their frustrations and their victories. This data humanizes the journey. It gives voice to the persona.
Quantitative Data
This includes analytics, survey scores, and transaction logs. It answers the “what” and “how much.” It validates the frequency of certain behaviors. If analytics show 80% drop-off at a specific step, that is a major indicator. Combining this with interview data explains why the drop-off is happening.
Validation Process
Once the draft map is created, it must be validated. This involves taking the map to the people who perform the work. Frontline staff know where the friction exists. They can confirm if the phases match reality. They can also identify internal constraints. Additionally, show the map to actual customers. Ask them if it matches their experience. If they say, “No, I actually do this differently,” you must adjust the map. Validation ensures the artifact remains accurate over time. It builds trust in the process among stakeholders.
Maintenance and Iteration 🔁
A journey map is a living document. It is not a one-time project. Customer behaviors change. Products evolve. Markets shift. A map created today might be obsolete in six months. Regular reviews are necessary to keep it relevant.
- Quarterly Reviews: Check if new features have altered the path.
- Post-Launch Audits: Update the map after major releases.
- Feedback Loops: Integrate new customer feedback into the map immediately.
Assign an owner to the map. This person is responsible for keeping it updated. They ensure that the opportunities section is being tracked. They facilitate the sharing of the map across teams. Without maintenance, the map loses its authority. Teams will stop using it as a reference. To sustain impact, treat the map as a central source of truth. Keep it accessible. Update it visibly. Celebrate the wins that result from the insights.
Conclusion on Implementation 🚀
Building a high-impact journey map is a discipline. It requires attention to detail and a commitment to truth. By focusing on these seven components, you create a tool that drives real change. It aligns teams. It highlights risks. It uncovers opportunities. It places the customer at the center of decision-making. The effort invested in creating this artifact pays dividends in improved satisfaction and efficiency. It transforms vague feelings into concrete strategies. Use this guide as a foundation for your next mapping initiative. Ensure every element is present and accounted for. This is how you build experiences that truly matter.

