Every business wants smooth transactions. Customers want effortless experiences. When these two goals clash, friction occurs. Friction is the resistance a user feels while trying to achieve a goal. It is the delay, the confusion, the extra step, or the missing information that stops progress. Identifying these pain points is critical for maintaining growth and retention.
This guide provides a structured approach to locating friction within your customer journey. It focuses on actionable methods rather than theoretical concepts. By following these steps, teams can pinpoint where users drop off and why. The goal is clarity, efficiency, and measurable improvement.
🧠 Understanding Customer Journey Friction
Friction is not always negative. A small amount of resistance can encourage deliberate decision-making. However, excessive friction creates barriers that lead to abandonment. Understanding the nature of this resistance is the first step toward removal.
What Constitutes Friction?
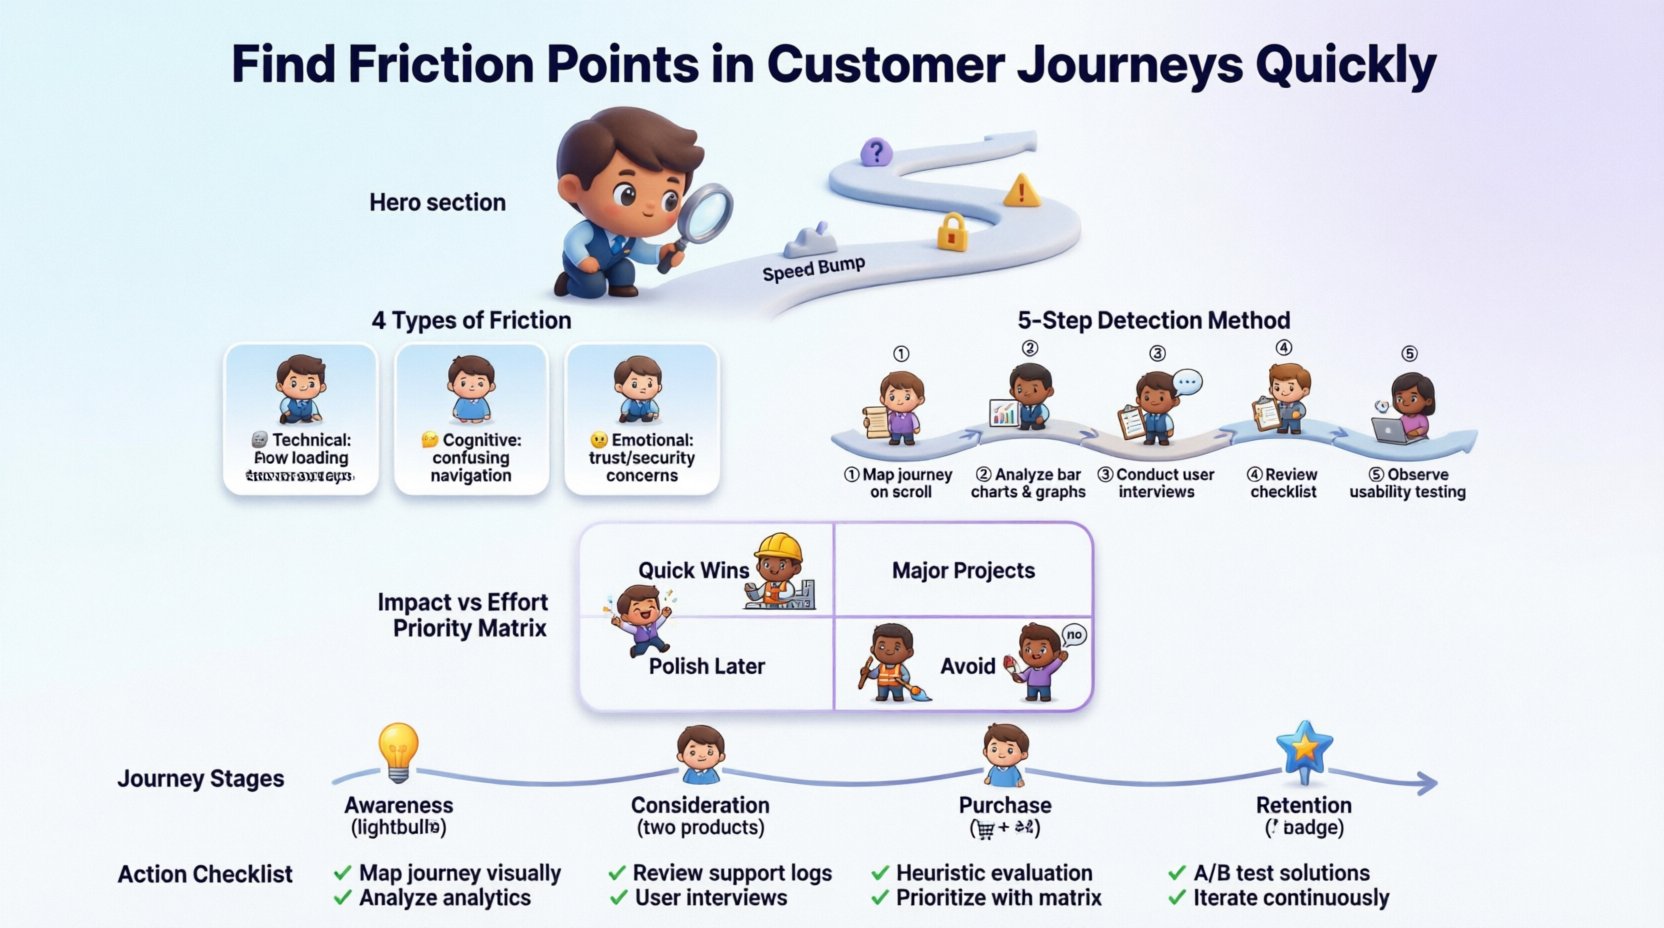
Friction manifests in various forms. It is not limited to technical errors or broken links. It exists in the psychology of the user as well as the structure of the process.
- Technical Friction: Slow loading times, broken forms, or compatibility issues.
- Cognitive Friction: Confusing navigation, unclear instructions, or jargon-heavy content.
- Process Friction: Too many steps in a checkout flow or excessive data entry requirements.
- Emotional Friction: Fear of commitment, lack of trust, or anxiety about security.
Recognizing which type of friction a user encounters allows for targeted solutions. A slow load time requires engineering. A confusing label requires copywriting.
📊 Common Types of Friction Points
Not all friction points are equal. Some cause immediate abandonment, while others cause long-term disengagement. The table below categorizes common friction points found across digital and physical touchpoints.
| Category | Common Example | Impact Level |
|---|---|---|
| Onboarding | Forced registration before viewing value | High |
| Search | Results do not match user intent | Medium |
| Checkout | Hidden costs appearing late | High |
| Support | Long wait times for human assistance | Medium |
| Account Management | Difficulty changing payment details | Medium |
| Content | Promises not delivered in the text | Low |
🛠️ Methodologies to Identify Friction
Locating friction requires a mix of observation, data analysis, and direct feedback. Relying on a single source of truth often leads to incomplete pictures. The following methodology outlines a systematic approach to discovery.
1. Map the Current State
You cannot improve what you do not define. Start by documenting the existing journey. Create a visual representation of every step a customer takes from initial awareness to final purchase. Include every channel, including email, social media, and physical interactions if applicable.
- Identify every touchpoint.
- Define the user goal at each stage.
- Map the internal process required to fulfill that goal.
- Note where the handoff occurs between departments.
This map serves as the baseline. It highlights gaps where information might be lost or where processes might duplicate efforts.
2. Analyze Quantitative Data
Numbers tell the story of what happened. They do not always explain why, but they point to the location of the problem. Focus on metrics that indicate resistance.
- Bounce Rates: High bounce rates on specific pages suggest immediate confusion or lack of relevance.
- Drop-off Rates: Where do users leave the funnel? A spike in abandonment between the cart and payment page indicates pricing or trust issues.
- Time on Page: Extremely short times may mean the content is unreadable. Extremely long times may mean the user is confused and struggling to find information.
- Error Rates: How often do users submit invalid data? This points to unclear form requirements.
3. Analyze Qualitative Data
Numbers provide the “where.” Qualitative data provides the “why.” This involves listening to the customer directly.
- User Interviews: Conduct one-on-one sessions to discuss their experience. Ask open-ended questions about their frustrations.
- Surveys: Deploy targeted questions at moments of friction. Ask users to rate their ease of use immediately after a task.
- Customer Support Logs: Review tickets and chat logs. Common complaints highlight systemic issues.
- Session Recordings: Watch users interact with the interface. Look for hesitation, rage clicks, or scrolling patterns that indicate confusion.
4. Conduct Heuristic Evaluations
Heuristic evaluation involves experts reviewing the journey against established usability principles. This is a proactive check before user testing.
- Check for consistency in design and language.
- Verify that system status is always visible to the user.
- Ensure error messages are helpful and constructive.
- Validate that users can easily undo actions.
5. Test with Real Users
Theory often fails when tested against reality. Usability testing reveals friction that internal teams miss. Because team members are too familiar with the product, they anticipate steps that confused users might not see.
- Ask users to complete specific tasks without assistance.
- Record their thought process while they work.
- Observe where they stop or ask for help.
- Note where they deviate from the intended path.
📈 Prioritizing Friction Points
You will not find every friction point at once. Resources are limited. You must prioritize which issues to solve first. Use a prioritization matrix to evaluate potential fixes.
Impact vs. Effort Analysis
Plot every identified friction point on a grid. The vertical axis represents the impact on the business (e.g., revenue, retention). The horizontal axis represents the effort required to fix the issue.
- High Impact, Low Effort: Fix these immediately. These are quick wins that yield significant results.
- High Impact, High Effort: Plan these for major initiatives. They require budget and time.
- Low Impact, Low Effort: Do these when capacity allows. They polish the experience.
- Low Impact, High Effort: Avoid these. They do not justify the cost.
🔎 Deep Dive: Friction by Journey Stage
Different stages of the journey have unique friction profiles. Understanding these nuances helps tailor the investigation.
Awareness Stage
Users are just discovering your brand. Friction here is often about relevance and trust.
- Keyword Mismatch: Ads promise something the landing page does not deliver.
- Slow Entry: Long loading times before the content appears.
- Privacy Concerns: Too many permissions requested immediately.
Consideration Stage
Users are comparing options. Friction here is about information clarity and differentiation.
- Complex Pricing: Hidden fees or confusing tiers.
- Missing Specs: Lack of detailed information needed for comparison.
- Comparison Tools: Inability to easily compare products side-by-side.
Purchase Stage
Users are ready to buy. Friction here is about security and ease of transaction.
- Account Creation: Forcing sign-up before purchase.
- Payment Errors: Unclear error messages when cards decline.
- Shipping Costs: Calculated too late in the process.
Retention Stage
Users are active customers. Friction here is about value and support.
- Onboarding: Failing to show how to use the product effectively.
- Support Access: Hard to find contact information.
- Updates: Changes that disrupt established workflows.
🛡️ Validating Findings
Once you identify a friction point, do not assume you know the root cause. Validate your hypothesis before implementing large-scale changes.
- A/B Testing: Create variations of the flow. Compare the conversion rates of the original against the modified version.
- Control Groups: Ensure that changes are not influenced by external factors like seasonality.
- Follow-up Feedback: Ask users after the change if the friction is gone. Quantitative data shows the result, but qualitative data confirms the user feeling.
🔄 The Iterative Cycle
Finding friction is not a one-time project. It is an ongoing cycle. Markets change, user behaviors evolve, and new competitors enter the space. What works today may create friction tomorrow.
Establish a regular cadence for reviewing the journey. Schedule quarterly audits of the top drop-off points. Monitor support ticket trends monthly. Keep a backlog of friction points that are being addressed over time.
Continuous improvement requires a culture that values the customer experience over internal convenience. Every department, from engineering to marketing, must understand how their actions contribute to the overall journey.
📝 Summary of Actions
To summarize the process of finding friction points quickly, follow this checklist:
- ✅ Map the current journey visually.
- ✅ Analyze analytics for drop-off spikes.
- ✅ Review support logs for recurring complaints.
- ✅ Conduct user interviews to gather qualitative insights.
- ✅ Perform heuristic evaluations against usability standards.
- ✅ Prioritize fixes using an Impact vs. Effort matrix.
- ✅ Validate solutions through A/B testing.
- ✅ Monitor results and iterate continuously.
Friction is the silent tax on your business. It erodes revenue and damages reputation without making a loud noise. By systematically identifying and removing these barriers, you create a path of least resistance for your customers. This leads to higher conversion rates, better satisfaction scores, and sustainable growth.
Start by mapping one journey. Find one point of resistance. Remove it. Measure the result. Repeat. This disciplined approach builds a resilient customer experience that stands the test of time.
📋 Frequently Asked Questions
How often should I audit my customer journey?
A comprehensive audit should happen quarterly. However, micro-checks should occur monthly based on new data releases or feature updates.
Can I fix friction without technical resources?
Yes. Many friction points are related to copy, layout, or process flow. These can often be resolved with content changes or workflow adjustments without coding.
What is the most common source of friction?
Unexpected costs and forced account creation are consistently cited as top friction points across industries.
How do I get stakeholder buy-in to fix friction?
Present data. Show the revenue loss associated with the friction point. Demonstrate the return on investment for fixing it. Use customer quotes to humanize the data.

