Agile methodologies promise flexibility, speed, and value delivery. Yet, many teams find themselves stuck in a cycle of measuring what is easy rather than what is meaningful. For years, the standard conversation has revolved around velocity and burn-down charts. These metrics offer a snapshot of activity, but they rarely reflect the actual health, efficiency, or value of the work being produced. Relying on them exclusively creates a false sense of progress and can lead to unintended behaviors that harm long-term sustainability.
To truly understand the pulse of a development team, we must look deeper. We need to shift focus from output to outcome, from activity to flow, and from speed to stability. This guide explores the essential metrics that provide real insight into your agile journey, helping you make better decisions without the need for complex tools or software products.
⚠️ Why Velocity and Burn-down Charts Often Fall Short
Velocity measures the amount of work a team completes in a sprint, usually expressed in story points. Burn-down charts track the remaining work against time. Both are popular because they are easy to calculate. However, they suffer from significant limitations that can distort reality.
Potential for Gaming: When velocity becomes a target, teams may inflate story point estimates to look better. This distorts future planning and creates a culture of estimation rather than delivery.
Ignoring Quality: A high velocity does not guarantee high quality. A team can burn through technical debt and introduce bugs quickly, masking the true cost of development.
Scope Creep: Burn-down charts can be manipulated. If new work is added mid-sprint, the chart might still show a downward trend, hiding the fact that the original scope was abandoned.
Lack of Context: Velocity is specific to a team and a timeframe. It cannot be compared across different teams without considering complexity, experience, and domain knowledge.
When management focuses on these numbers, the team often feels pressure to optimize for the metric rather than the customer. This disconnect is why modern agile practices encourage looking at a broader set of indicators.
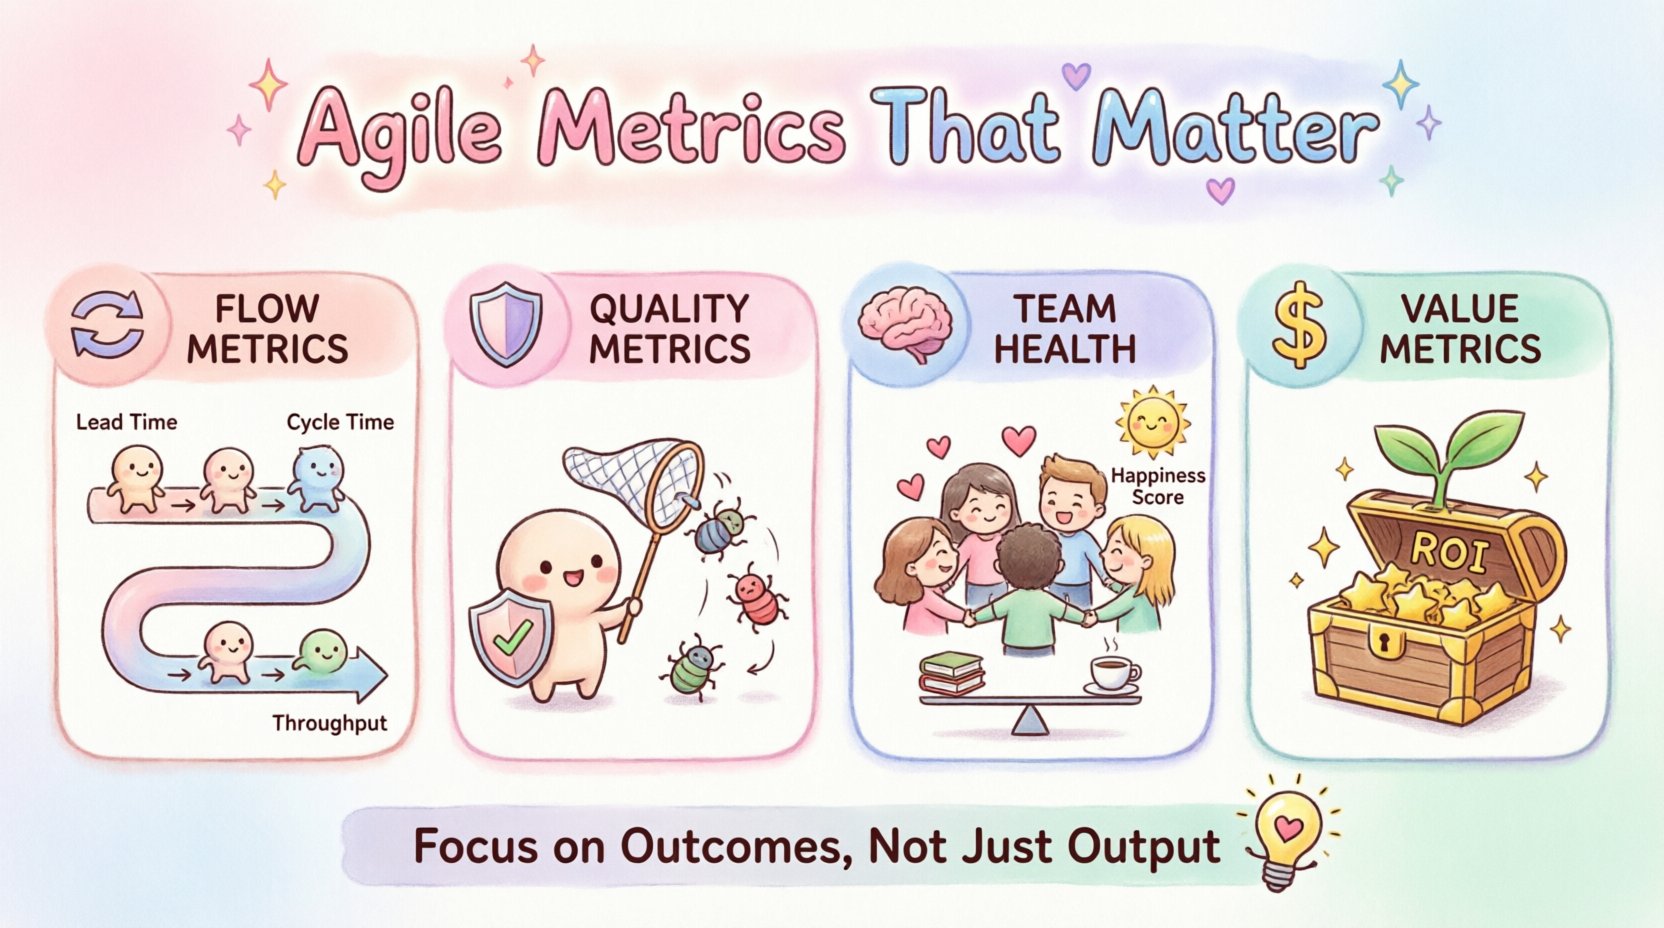
🔄 Flow Metrics: Understanding the Movement of Work
Instead of counting how many tasks are done, flow metrics measure how work moves through the system. These metrics are rooted in Lean thinking and provide a clearer picture of efficiency and bottlenecks.
1. Lead Time
Lead time is the total duration from when a customer makes a request until that request is fully delivered and in production. It encompasses the entire lifecycle, including waiting time in the backlog.
Why it matters: This is the metric customers actually care about. It answers the question, “How long do I have to wait?”
Goal: Reducing lead time increases responsiveness and allows for faster feedback loops.
Calculation: Date of completion minus Date of request.
2. Cycle Time
Cycle time measures the time from when work actually begins until it is finished. Unlike lead time, it excludes the time spent waiting in the queue.
Why it matters: It highlights the efficiency of the development process itself. Long cycle times often indicate bottlenecks in testing, code review, or deployment.
Goal: Streamlining the workflow to minimize interruptions and handoffs.
Calculation: Date of completion minus Date of start.
3. Throughput
Throughput counts the number of items completed in a specific period. While velocity counts points, throughput counts items.
Why it matters: It is more stable than velocity because it does not rely on subjective story point estimation.
Goal: Predicting future capacity based on historical averages.
Metric | What it Measures | Primary Use Case |
|---|---|---|
Lead Time | Request to Delivery | Customer Expectations & Planning |
Cycle Time | Start to Finish | Process Efficiency & Bottlenecks |
Throughput | Items Completed | Capacity Planning |
🛡️ Quality Metrics: Ensuring Sustainable Delivery
Speed without quality is a liability. High velocity often leads to technical debt, which slows teams down over time. To maintain a healthy pace, you must measure the quality of the output.
1. Defect Escape Rate
This metric tracks the number of bugs found by users or in production after a release. It indicates how well your testing processes catch issues before they reach the customer.
Why it matters: A high escape rate means customers are experiencing friction, and the team is spending more time fixing production issues than building new features.
Goal: Shift testing left. Catch defects earlier in the lifecycle to reduce the cost of fixing them.
2. Reopen Rate
When a ticket is marked as done but requires rework, it is reopened. A high reopen rate suggests that the definition of done is not being met or that the initial implementation was flawed.
Why it matters: It represents wasted effort. Work that is marked complete but needs rework disrupts flow and lowers morale.
Goal: Improve the quality of code reviews and ensure acceptance criteria are clear before work begins.
3. Production Incidents
Counting the number of outages or critical failures in a given period provides a direct measure of system stability.
Why it matters: Stability is a prerequisite for trust. If the system is unstable, users will not adopt new features.
Goal: Implement robust monitoring and automated alerts to detect issues before they become incidents.
🧠 Team Health & Sustainability Metrics
A burnt-out team cannot deliver high-quality work. Sustainable pace is a core tenet of agile, yet it is often ignored in favor of aggressive deadlines. Measuring team health is crucial for long-term success.
1. Workload Balance
Not all team members should carry the same load. Uneven distribution leads to bottlenecks where one person becomes the single point of failure.
Why it matters: If one developer is overloaded, they become a blocker for others. If another is underloaded, capacity is wasted.
Goal: Ensure tasks are distributed evenly and cross-training is encouraged to reduce dependency on individuals.
2. Overtime Frequency
Tracking the number of hours worked beyond the standard schedule indicates stress levels.
Why it matters: Occasional overtime happens, but consistent overtime is a sign of overcommitment and leads to burnout.
Goal: Adjust sprint commitments to match actual capacity.
3. Bus Factor
This is a measure of knowledge risk. It asks how many people need to be hit by a bus (leave the team) before the project stalls.
Why it matters: Low bus factor means critical knowledge is siloed. If that person leaves, the project suffers.
Goal: Encourage pair programming, documentation, and shared ownership of code.
4. Happiness Score
Regular surveys asking team members to rate their satisfaction with the work environment, processes, and workload.
Why it matters: Happiness correlates with productivity and retention. Unhappy teams leave, and replacing them is expensive.
Goal: Act on feedback to improve the working environment.
💰 Value Metrics: Aligning with Business Goals
Delivering features is not the same as delivering value. Teams must ensure they are building the right things, not just building things right.
1. Business Value Delivered
Estimating the business value of completed work, often done collaboratively with product owners. This can be a relative score (1-10) assigned to features.
Why it matters: It helps prioritize the backlog based on impact rather than effort alone.
Goal: Maximize the return on investment for every sprint.
2. Feature Adoption Rate
Once a feature is released, how many users are actually using it?
Why it matters: If nobody uses a feature, the time spent building it was wasted.
Goal: Validate assumptions early and pivot if adoption is low.
3. Return on Investment (ROI)
Comparing the cost of development against the revenue or savings generated by the feature.
Why it matters: It justifies the budget and proves the worth of the agile team to stakeholders.
Goal: Focus on high-value initiatives that drive growth.
🛠️ Implementing Metrics Without Tools
You do not need expensive software to track these metrics. In fact, manual tracking can encourage better conversation. Here is how to start.
Use Spreadsheets: A simple shared sheet can track cycle times, bug counts, and release dates. Update it weekly.
Visual Boards: Physical whiteboards with sticky notes can show flow. Use colored pens to mark blockers or quality issues.
Retrospectives: Make metrics a standard agenda item. Discuss trends, not just numbers.
Define Thresholds: Agree on what constitutes a “normal” range for metrics. If lead time spikes, investigate why.
Focus on Conversation: Use the data to ask questions. “Why did cycle time increase this week?” is more valuable than “The cycle time is high.”
⚠️ Common Pitfalls to Avoid
Even with better metrics, teams can make mistakes in how they use them.
1. Vanity Metrics
Metrics that look good but don’t drive action. For example, the number of commits per developer can encourage quantity over quality.
2. Micromanagement
Using metrics to police individual performance rather than improve the system. This destroys trust and encourages hiding problems.
3. Analysis Paralysis
Collecting too much data. Focus on 3-5 key metrics that align with your current goals. Too many numbers create noise.
4. Ignoring Context
Comparing metrics without understanding the specific challenges of a project. A legacy system maintenance task is different from building a new product.
📈 Moving Forward
Transitioning away from velocity and burn-down charts requires discipline. It means accepting that some things are harder to measure than others. However, the insights gained from flow, quality, health, and value metrics are far more actionable.
Start by selecting one new metric to track. Perhaps cycle time or defect escape rate. Discuss the data openly in your next retrospective. Look for trends over time, not just single data points. As the team becomes comfortable with these measurements, expand to others.
Remember, the goal is not to measure perfectly. The goal is to improve continuously. By focusing on the right signals, you create an environment where transparency, quality, and value thrive. This approach builds a culture where the team is empowered to deliver consistent results without the pressure of arbitrary targets.
Take the time to understand your system. Measure what matters. Let the data guide your improvements, not dictate your behavior. This is the path to sustainable agile maturity.

