Constructing a B2B sales cycle journey map is a strategic exercise that aligns internal operations with external customer behaviors. Unlike B2C transactions, B2B sales involve complex decision-making processes, multiple stakeholders, and longer timelines. A well-constructed map visualizes the path a prospect takes from initial awareness to final purchase and ongoing advocacy. This document outlines the methodology for building a robust journey map that drives efficiency and revenue.
🧩 Understanding the B2B Landscape
B2B sales cycles differ fundamentally from consumer interactions. The stakes are higher, the budget approval chains are longer, and the risk of failure is significant for the buyer. A journey map in this context is not merely a timeline; it is a psychological and operational blueprint.
- Complexity: Multiple departments (IT, Finance, Operations) often evaluate the same solution.
- Duration: Deals can stretch from months to years depending on contract size.
- Relationship: Trust is the primary currency. Sales interactions must build credibility over time.
Without a clear map, teams operate in silos. Marketing generates leads without understanding sales readiness. Sales prospects follow up without context on previous interactions. The journey map bridges this gap.
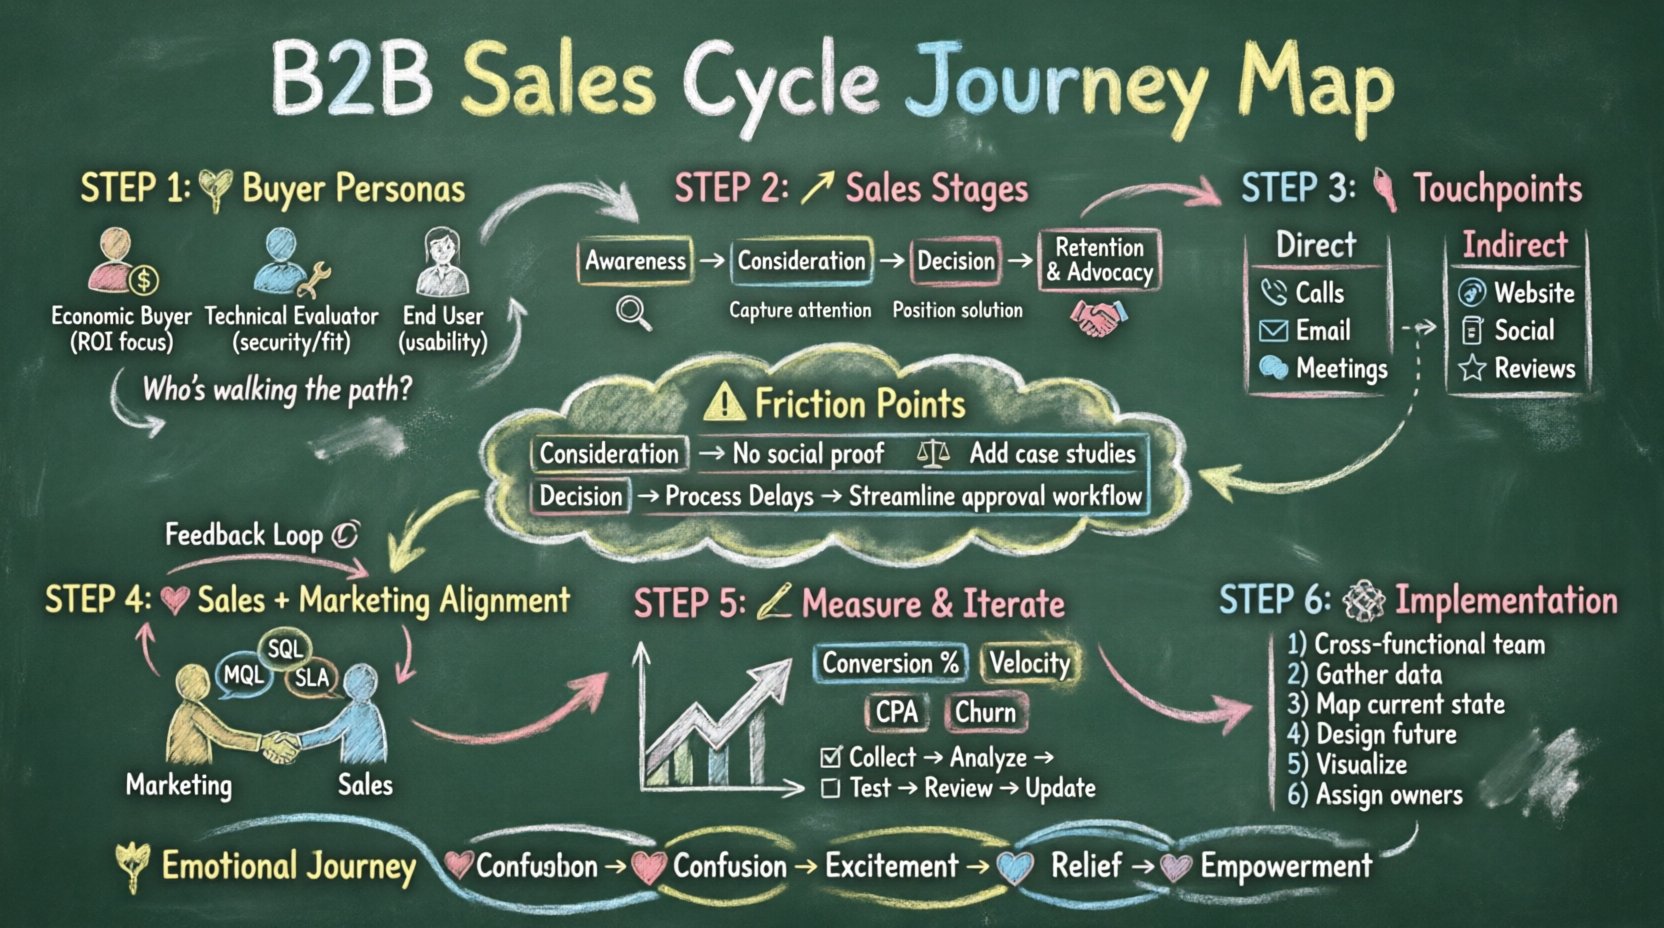
👥 Step 1: Defining Buyer Personas
You cannot map a journey without knowing who is walking the path. In B2B, you are rarely selling to one person. You are selling to a committee. Defining these personas is the foundation of the map.
The Economic Buyer
This individual controls the budget. They care about ROI, total cost of ownership, and strategic alignment. Their journey is focused on value justification.
The Technical Evaluator
This person assesses feasibility, security, and integration capabilities. They look for specifications, compliance, and scalability. Their journey is focused on risk mitigation.
The End User
These are the people who will actually use the product daily. They care about usability, training, and workflow efficiency. Their journey is focused on adoption and ease of use.
| Persona Type | Primary Goal | Key Questions | Primary Objections |
|---|---|---|---|
| Economic Buyer | ROI & Strategy | “Will this save money?” | “Is the cost justified?” |
| Technical Evaluator | Security & Fit | “Does it work with our stack?” | “Is it secure?” |
| End User | Usability | “Will this make my job harder?” | “Is it too complex?” |
🔄 Step 2: Mapping the Sales Stages
The sales cycle is typically divided into distinct stages. Each stage represents a shift in the prospect’s mindset and readiness. Mapping these stages allows you to tailor messaging and resources appropriately.
1. Awareness
The prospect realizes they have a problem. They are searching for solutions but have not yet identified a vendor. Content here should be educational, focusing on pain points rather than product features.
- Goal: Capture attention and validate the problem.
- Content: Industry reports, problem-solving guides, webinars.
- Metrics: Traffic, time on page, social shares.
2. Consideration
The prospect has defined their problem and is evaluating potential solutions. They are comparing approaches and vendors. They are looking for differentiation.
- Goal: Position your solution as the best fit.
- Content: Case studies, comparison charts, whitepapers.
- Metrics: Demo requests, content downloads, email engagement.
3. Decision
The prospect has narrowed the list to a few finalists. They are negotiating terms, pricing, and implementation details. This is the highest risk point for churn.
- Goal: Remove friction and finalize the agreement.
- Content: Proposals, contract templates, executive references.
- Metrics: Proposal acceptance rate, time to close.
4. Retention & Advocacy
The sale is not the end. In B2B, the lifetime value comes from renewal and expansion. The journey continues into onboarding and account management.
- Goal: Ensure success and drive referrals.
- Content: Training materials, success stories, renewal incentives.
- Metrics: Churn rate, Net Promoter Score, expansion revenue.
👣 Step 3: Identifying Touchpoints
A journey map is useless if it ignores the specific interactions (touchpoints) the customer has with your brand. These touchpoints accumulate to form the customer’s perception.
Direct Touchpoints
These are interactions where communication is one-to-one or one-to-many.
- Sales Calls: Discovery calls, demos, negotiation meetings.
- Email: Cold outreach, nurturing sequences, follow-ups.
- Phone: Support tickets, account management calls.
- Meetings: In-person workshops or conferences.
Indirect Touchpoints
These are interactions the customer has without direct communication from your team.
- Website: Landing pages, blog posts, pricing pages.
- Social Media: LinkedIn updates, comments, shares.
- Third-Party Reviews: G2, Capterra, industry analyst reports.
- Advertising: PPC ads, retargeting banners.
It is critical to audit these touchpoints for consistency. If the sales team promises speed but the website load time is slow, the map reveals a disconnect.
⚠️ Step 4: Pinpointing Friction and Pain Points
Friction is the resistance a prospect feels at any stage of the journey. High friction leads to drop-offs. Identifying where the road gets bumpy is essential for optimization.
Common Sources of Friction
- Information Overload: Too many technical specs without clear benefits.
- Process Delays: Slow response times from support or sales.
- Administrative Burden: Complex forms or lengthy contract review processes.
- Unclear Value: The customer does not understand the ROI.
- Channel Confusion: The customer contacts sales via email but gets a call they didn’t expect.
| Journey Stage | Common Friction Point | Resolution Strategy |
|---|---|---|
| Awareness | Vague messaging | Clarify problem statement in copy |
| Consideration | Lack of social proof | Add specific case studies |
| Decision | Slow contract review | Implement streamlined legal workflow |
| Retention | Poor onboarding | Create structured implementation plan |
🤝 Step 5: Aligning Sales and Marketing
The biggest failure point in B2B journey mapping is the disconnect between Marketing and Sales. Marketing often hands off leads that Sales deems “cold,” while Sales feels Marketing is not generating enough volume. The journey map serves as a shared source of truth.
Defining Handoff Criteria
Both teams must agree on what constitutes a qualified lead. This agreement prevents wasted effort and frustration.
- MQL (Marketing Qualified Lead): A prospect who has engaged with content but may not be ready to buy.
- SQL (Sales Qualified Lead): A prospect who has been contacted and shows intent to purchase.
- SLA (Service Level Agreement): A formal agreement defining how quickly Sales must follow up with Marketing leads.
Feedback Loops
Continuous communication is necessary. Sales should provide feedback on lead quality back to Marketing. Marketing should inform Sales of new campaigns or content assets. This loop ensures the map evolves based on real-world data.
📊 Step 6: Measuring and Iterating
A journey map is a living document. It requires regular updates based on performance data and market changes. Static maps become obsolete quickly.
Key Performance Indicators
- Conversion Rates: Track the percentage of prospects moving from one stage to the next.
- Velocity: Measure the average time spent in each stage.
- Cost Per Acquisition (CPA): Calculate the marketing spend required to convert a lead at each stage.
- Churn Rate: Monitor how many customers leave after the sale.
Iterative Process
- Collect Data: Gather analytics and sales feedback.
- Analyze Gaps: Identify where prospects are stalling or dropping off.
- Test Changes: Implement new processes, content, or messaging.
- Review Results: Measure the impact of the changes.
- Update Map: Reflect findings in the visual representation.
Regular reviews ensure the organization adapts to shifting buyer behaviors. For example, if buyers start researching more on social media, the map should reflect increased investment in social channels during the consideration stage.
🛠️ Practical Implementation Steps
Putting this theory into practice requires a structured approach. Follow these steps to build your map.
1. Assemble a Cross-Functional Team
Include members from Sales, Marketing, Customer Success, and Product. Diverse perspectives ensure the map covers all angles of the customer experience.
2. Gather Qualitative Data
Conduct interviews with recent customers. Ask what influenced their decision. Interview sales representatives on their biggest objections. Review call recordings to understand the conversation flow.
3. Map the Current State
Document the journey as it exists today, not as you wish it to be. This highlights the gaps between expectation and reality.
4. Design the Future State
Create the ideal journey. Where should the customer be? How should they feel at each step? What resources should be available to them?
5. Visualize and Share
Use a whiteboard or digital tool to create a visual representation. Share this widely within the organization. It should be accessible to everyone involved in the revenue process.
6. Assign Ownership
Every stage of the journey needs an owner. Who is responsible for optimizing the awareness stage? Who owns the handoff to sales? Clear accountability drives action.
🚧 Common Pitfalls to Avoid
When constructing these maps, organizations often make specific mistakes that undermine the effort.
- Internal Focus: Mapping based on internal processes rather than customer needs. The map should start with the customer, not the product.
- One Size Fits All: Assuming all customers have the same journey. Segment by persona or deal size if necessary.
- Ignoring the Post-Sale: Focusing only on acquisition. Retention is often more profitable than new business.
- Static Data: Relying on old data. Buyer behaviors change with market conditions.
- Lack of Execution: Creating the map but never acting on the insights. The map is a tool for action, not decoration.
💡 The Emotional Dimension
Beyond the functional steps, a journey map must account for the emotional state of the buyer. Buying in B2B is stressful. It involves risk and responsibility.
- Confusion: Early stages often involve confusion about options.
- Excitement: Discovery of a potential solution can generate hope.
- Anxiety: Concerns about implementation, cost, and failure peak during decision-making.
- Relief: Successful onboarding brings a sense of security.
- Empowerment: Long-term usage should make the customer feel more capable.
Addressing these emotions through empathetic communication and support can differentiate your offering from competitors who focus solely on features.
🔗 Integrating Technology
While the strategy is human-centric, technology enables the execution. You need systems that track interactions across the journey.
- Data Integration: Ensure all systems talk to each other to provide a unified view.
- Automation: Use automation to nurture leads but keep the human touch for high-value interactions.
- Analytics: Implement robust tracking to measure journey performance.
The goal is not to replace human interaction with technology, but to make human interactions more informed and effective. Technology should provide the data that allows sales reps to understand where a prospect is in their journey.
🏁 Finalizing the Strategy
Building a B2B sales cycle journey map is an investment in clarity and efficiency. It forces the organization to look through the customer’s eyes. It highlights inefficiencies in the sales process. It aligns teams around a common goal.
Success comes from consistent execution and continuous improvement. The map is never finished. As markets evolve, so must the journey. By maintaining a focus on the customer experience, organizations can build sustainable growth and stronger relationships.
Start with the data you have. Fill in the gaps with research. Test your assumptions. Refine the map based on results. This iterative process ensures your sales cycle remains competitive and customer-centric.

