


Building software without evidence is akin to navigating a ship without a compass. You might be moving, but are you moving toward the destination your customers actually want? Too often, product teams invest weeks of engineering time into features that see little to no adoption. This is the cost of unvalidated assumptions. To mitigate risk and ensure every line of code delivers value, you must anchor your user stories in real customer data before a single story is written in your backlog.
This guide outlines a rigorous approach to validating user stories using empirical evidence. We will explore how to gather the right signals, interpret them without bias, and translate raw data into actionable acceptance criteria. By shifting your focus from intuition to evidence, you reduce waste and build products that resonate.
Why Validation Matters: The Cost of Assumption 💸
When a product owner writes a user story based on a hunch, the development team builds it. If the assumption is wrong, the effort is sunk. The cost of failure increases exponentially as you move further from the discovery phase. If you discover a flaw during sprint planning, it is cheap to fix. If you discover it after deployment, it is expensive.
Validation serves as a gatekeeper. It ensures that the problem you are solving is real, the solution you are proposing is viable, and the user is willing to engage with it. Without this step, you risk:
- Wasted Development Capacity: Engineers spend time building features that generate no business value.
- Feature Bloat: Accumulation of unused functionality that complicates the user interface.
- Lost Trust: Customers become frustrated when you release tools they did not ask for.
- Opportunity Cost: Time spent on low-value features is time not spent on high-value ones.
Real customer data acts as the objective truth. It removes the loudest voice in the room from the decision-making process and replaces it with behavior and feedback.
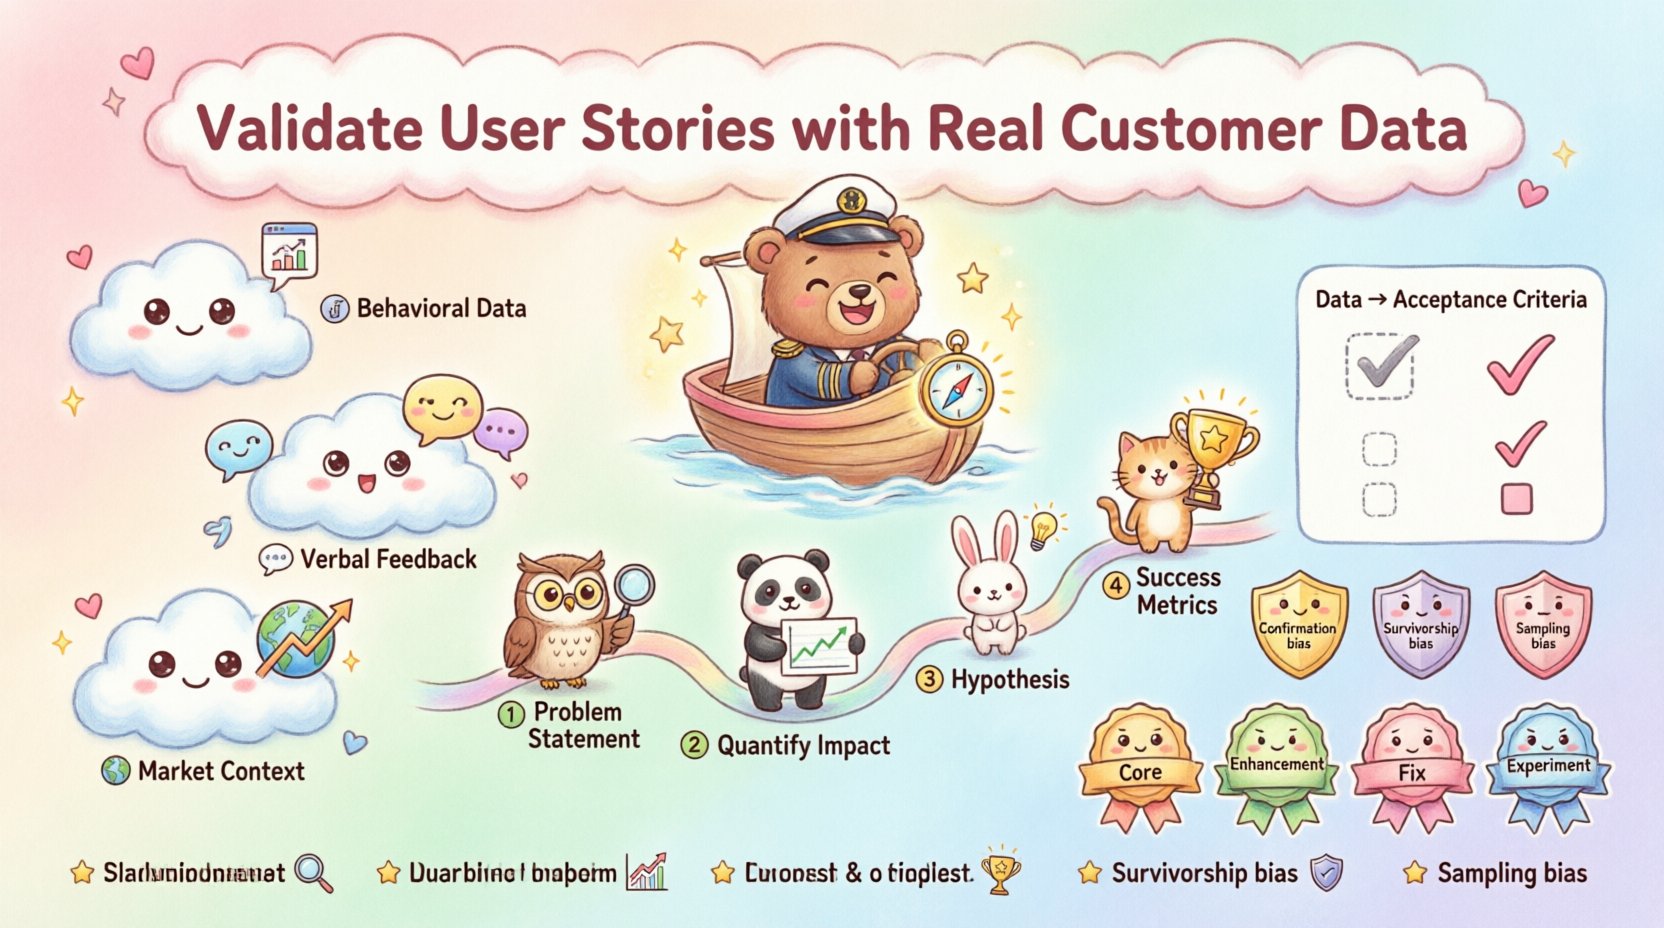
Sources of Customer Truth 🔍
Data is not just numbers on a dashboard. It is qualitative and quantitative. To validate effectively, you must triangulate information from multiple sources. Relying on a single data point often leads to skewed conclusions. Below are the primary categories of data you should leverage.
1. Behavioral Data
Behavioral data tells you what users do, not what they say. This is often the most reliable indicator of intent. Look for patterns in how users interact with your current digital products.
- Usage Analytics: Where do users drop off in a funnel? Which buttons are clicked most frequently?
- Session Recordings: Watch how users navigate complex flows. Do they get confused? Do they hover over elements they cannot click?
- Feature Adoption Rates: Which existing features have the highest retention? This indicates where users find value.
2. Verbal Feedback
While behavior is king, verbal feedback provides context. Users might not know how to express a need in technical terms, but they can describe their pain points.
- Support Tickets: Analyze recurring issues logged in your help desk. These are direct indicators of friction.
- Interviews: Conduct one-on-one conversations. Ask about their current workflow and where they struggle.
- Surveys: Use targeted questions to validate specific hypotheses about a new feature.
3. Market Context
Sometimes the data exists outside your product. Understanding the broader landscape helps validate if a problem is unique to you or a general industry trend.
- Competitor Analysis: Are competitors adding similar features? If so, is it a necessity or a differentiation strategy?
- Industry Reports: What are the emerging trends in your sector that could impact user expectations?
The Validation Framework 🛠️
Once you have access to these data sources, you need a structured method to process them. A framework ensures consistency across your team and prevents ad-hoc decision-making. Follow these steps to move from raw data to a validated user story.
Step 1: Identify the Problem Statement
Before thinking about a solution, define the problem. Use the data to articulate the gap. For example, instead of saying “We need a dark mode,” say “Users are reporting eye strain during night usage, leading to a 15% drop in engagement after 8 PM.”
- Source: Support tickets and analytics time-of-day usage.
- Goal: Reduce reported discomfort and recover evening engagement.
Step 2: Quantify the Impact
Assign numbers to the problem. This helps prioritize the story against others in the backlog. If only 1% of users are affected, it might not be a high priority. If 40% are affected, it is critical.
- Frequency: How often does this issue occur?
- Severity: How much does it hinder the user’s goal?
- Reach: How many users are impacted?
Step 3: Formulate the Hypothesis
Write down what you believe will happen if you solve this problem. This sets the stage for post-launch measurement.
Hypothesis: If we implement a dark mode, we will see a 10% increase in evening session duration.
Step 4: Define Success Metrics
Decide what data will prove the hypothesis was correct. This becomes part of the user story’s acceptance criteria.
- Primary Metric: Session duration during evening hours.
- Secondary Metric: Reduction in support tickets related to “eye strain” or “visibility”.
Turning Data into Acceptance Criteria 📝
Acceptance criteria define when a user story is complete. When validated by data, these criteria become measurable objectives rather than binary checkboxes. This shifts the team’s focus from “Did we build it?” to “Did it work?”
Here is how to structure data-driven acceptance criteria:
- Instead of: “The user can toggle dark mode.”
- Use: “The toggle is visible in the settings menu and persists across sessions.”
- And: “User satisfaction score regarding visibility increases by 5 points in post-release survey.”
- And: “No performance degradation observed on low-end devices during the transition.”
This approach ensures that the development team understands the why behind the what. It aligns engineering, product, and design around a shared goal.
Validation Signal Checklist 📋
Not all user stories require the same depth of validation. Use this table to determine how much evidence is needed before writing the story.
| Story Type | Validation Depth | Required Data Points | Example |
|---|---|---|---|
| Core Feature | High | Quantitative usage data, Qualitative interviews, Competitor analysis | New payment gateway integration |
| Enhancement | Medium | Support ticket trends, A/B test results on similar features | Adding filters to search results |
| Fix/Defect | Low | Error logs, Crash reports, Customer complaint volume | Button not clickable on Safari |
| Experiment | Variable | Market research, Small cohort testing | Testing a new onboarding flow |
High validation depth requires more time upfront but prevents costly pivots later. Low validation depth is acceptable when the risk of failure is minimal, such as fixing a bug.
Avoiding Cognitive Bias 🧠
Even with data, human interpretation introduces risk. Your team must be vigilant against common biases that distort validation.
Confirmation Bias
This occurs when you search for data that supports your existing belief and ignore data that contradicts it. If you want to build Feature X, you might only interview users who like Feature X.
- Mitigation: Actively seek out dissenting opinions. Interview users who have not used the product recently.
Survivorship Bias
This happens when you focus on successful data points and ignore the failures. For example, analyzing only users who completed the checkout process might hide why others dropped off.
- Mitigation: Study the drop-off points. Analyze the behavior of users who abandoned the cart.
Sampling Bias
Collecting data from a group that does not represent the whole population. If you only survey power users, you might build features that confuse beginners.
- Mitigation: Ensure your sample size includes new users, power users, and churned users.
Integrating into Sprint Planning 🗓️
Validation is not a separate phase; it is part of the continuous flow of product development. Integrate these practices into your existing rituals.
Backlog Refinement
During refinement sessions, require the product owner to present the data backing a story. If a story lacks evidence, it should not be moved to the sprint backlog. This creates a culture of accountability.
- Ask: “What data tells us this is the right thing to build?”
- Ask: “How will we measure success after release?”
The Definition of Ready
Update your Definition of Ready (DoR) to include validation evidence. A story is not ready for development until the hypothesis and success metrics are documented.
- DoR Item: Customer feedback summary attached.
- DoR Item: Analytics plan defined.
- DoR Item: Competitor benchmark included.
Post-Launch Verification 📈
Validation does not end when the code is deployed. It continues into the release phase. You must compare the actual results against the hypothesis formed during the validation phase.
Monitor Key Metrics
Immediately after launch, track the success metrics you defined. If the metrics do not move, the hypothesis was incorrect. This is not a failure of the team, but a success of the validation process. You learned something valuable.
- Positive Outcome: Metrics improved. Continue to iterate and optimize.
- Neutral Outcome: Metrics did not change. Analyze why. Did users not see the feature?
- Negative Outcome: Metrics declined. Pause and investigate. Did the feature break something else?
Feedback Loops
Keep the channel open for user feedback post-release. Sometimes the data shows a decline, but the qualitative feedback explains the reason. Combine both to understand the full picture.
- Release Notes: Explain the change clearly to users.
- In-App Feedback: Ask users if the new feature helped them.
- Customer Success: Have success managers reach out to key accounts.
Common Pitfalls to Avoid ⚠️
Even with a solid plan, teams often stumble. Be aware of these common mistakes.
- Data Paralysis: Spending too much time gathering data and never building. Validation has a point of diminishing returns. Aim for “good enough” evidence to make a decision, not perfect proof.
- Ignoring Negative Data: Dismissing data that shows a feature will fail. This is often the most valuable data you have.
- Confusing Correlation with Causation: Just because two metrics moved together does not mean one caused the other. Be careful when drawing conclusions from trends.
- One-Off Validation: Treating validation as a one-time event. User needs change. Re-validate periodically.
Building a Culture of Evidence 🏗️
Finally, make validation a cultural norm. It requires leadership support. When stakeholders see that data-driven decisions lead to higher quality products and happier customers, they will demand more of it.
- Share Wins: Celebrate when data saved you from building the wrong thing.
- Share Losses: Discuss what you learned when a hypothesis failed. Remove the stigma of failure.
- Train Teams: Ensure engineers and designers understand how to read basic analytics and interpret user feedback.
By embedding these practices, you move from a team that guesses to a team that knows. You build products that solve real problems for real people. This is the essence of product management.
Summary of Key Takeaways ✅
- Start with Data: Never write a story without a data-backed problem statement.
- Triangulate: Use behavioral, verbal, and market data together.
- Define Metrics: Know how you will measure success before you start.
- Check Bias: Actively look for evidence that contradicts your beliefs.
- Iterate: Validation is a cycle, not a linear step.
Adopting this approach requires discipline. It slows down the initial velocity of story writing. However, it accelerates the velocity of value delivery in the long run. You stop building what is easy and start building what matters. This is how you build products that last.

