Customer journey mapping is not merely a diagramming exercise. It is a strategic instrument designed to reveal friction, highlight opportunities, and align internal operations with external expectations. However, leadership teams frequently question the tangible return on investment for these initiatives. Without clear metrics, mapping projects risk being perceived as abstract work rather than core business drivers.
To justify the resources required for journey mapping, organizations must establish a rigorous framework for measuring performance. This guide details how to quantify the impact of your mapping projects, track key performance indicators, and demonstrate value over time. We will move beyond intuition and focus on data-driven evidence.
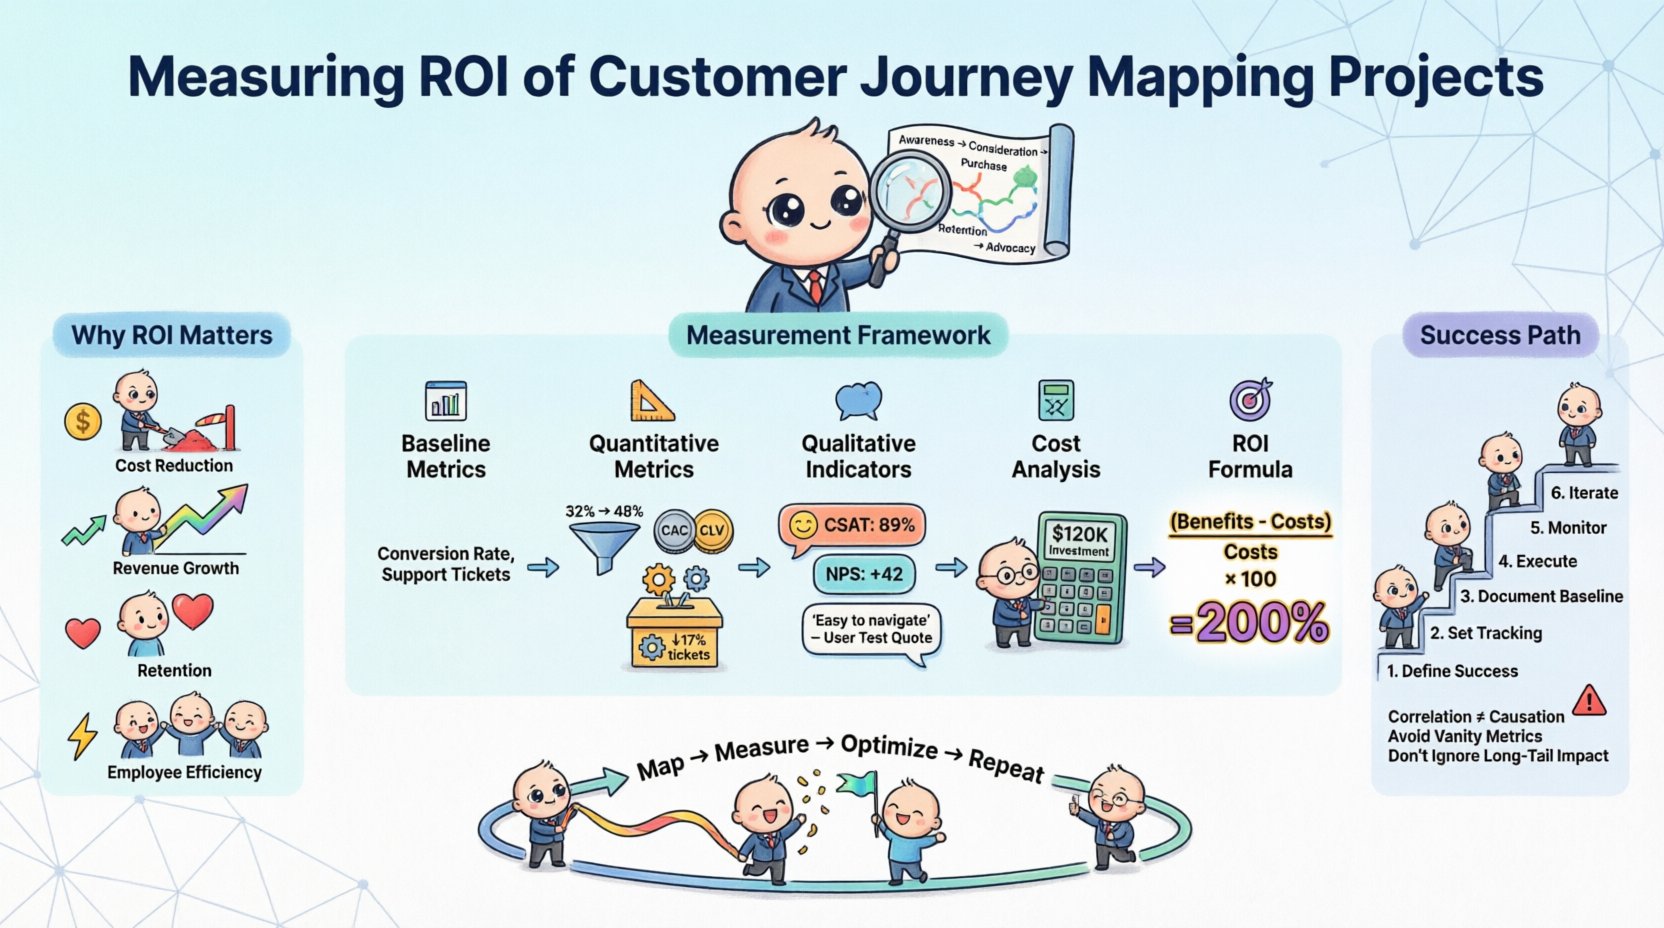
Why ROI Matters for Journey Mapping 🎯
Investing time and personnel in mapping customer interactions requires justification. Stakeholders need to understand how these efforts translate into revenue, efficiency, or retention. ROI calculation provides the necessary link between qualitative improvements and quantitative outcomes.
When measuring return on investment, consider the following drivers:
- Cost Reduction: Identifying friction points often reduces operational overhead. For example, if a specific checkout step causes 10% of users to abandon the cart, fixing it saves support costs and recovery efforts.
- Revenue Growth: Smoother journeys lead to higher conversion rates. Mapping helps identify drop-off points where revenue is lost.
- Retention: Understanding emotional touchpoints helps improve loyalty. Loyal customers cost less to serve and generate more lifetime value.
- Employee Efficiency: Clearer maps reduce internal confusion. Teams spend less time debating processes and more time executing.
Without a defined measurement strategy, you cannot distinguish between a successful initiative and a well-documented failure. The goal is to create a feedback loop where insights from the map inform action, and action is measured for results.
Establishing a Baseline 📉
Before you can measure improvement, you must know your starting point. A baseline represents the current state of performance before the mapping insights are implemented. This data is critical for comparison later in the lifecycle.
Key Baseline Metrics
Ensure the following data points are captured prior to launching any changes based on your maps:
- Current Conversion Rates: Document the percentage of users completing key actions across all stages.
- Average Handling Time: Record how long it takes for support teams to resolve issues related to specific journey stages.
- Customer Satisfaction Scores: Collect current CSAT or NPS scores associated with specific touchpoints.
- Bounce Rates: Identify pages or steps where users leave immediately.
- Churn Rate: Measure the percentage of customers leaving within a specific period.
If baseline data is missing, you may need to retroactively pull historical data from analytics platforms. Without this reference point, calculating percentage improvements becomes speculative.
Quantitative Metrics that Matter 💰
Quantitative data provides the hard numbers needed for financial justification. These metrics are directly tied to business outcomes and are easier to attribute to specific changes derived from journey mapping.
1. Conversion Rate Optimization
This is the most direct indicator of journey health. If your map reveals that users drop off at the account creation step, fixing the friction should result in more completed accounts. Track the lift in conversion rate specifically for that segment.
- Formula: (New Conversions – Old Conversions) / Old Conversions
- Example: If 100 users signed up last month and 120 sign up after optimization, the lift is 20%.
2. Customer Acquisition Cost (CAC)
A smoother journey often lowers the cost to acquire a customer. If marketing spends money to bring users in, but the journey is confusing, that spend is wasted. Optimizing the journey ensures the traffic acquired is actually converted.
- Impact: Reducing friction means you need less traffic to hit the same revenue target.
- Measurement: Compare CAC before and after journey improvements are deployed.
3. Customer Lifetime Value (CLV)
CLV measures the total revenue a business can expect from a single customer account. Journey mapping improves the experience, which increases the likelihood of repeat purchases.
- Focus: Look at repeat purchase rates and average order value post-journey implementation.
- Timeframe: CLV takes longer to materialize, so track this over quarters or years.
4. Support Ticket Volume
Friction often manifests as confusion, leading to support requests. If your journey map identifies a confusing policy page or a complex login process, resolving these should reduce the volume of tickets.
- Benefit: Lower ticket volume directly reduces labor costs.
- Attribution: Tag tickets by the journey stage where the issue originated.
Qualitative Indicators 🗣️
Numbers do not tell the whole story. Qualitative data explains why the numbers changed. These indicators are vital for understanding the customer sentiment behind the metrics.
1. Customer Satisfaction (CSAT)
Ask customers directly about their experience at specific touchpoints. A journey map highlights where pain points exist. Post-implementation surveys should reflect an improvement in sentiment.
- Method: Deploy micro-surveys after key interactions (e.g., after a purchase or support call).
- Goal: Increase the average score by at least 5-10%.
2. Net Promoter Score (NPS)
NPS measures loyalty. While influenced by product quality, the journey experience plays a significant role in how willing a customer is to recommend the brand.
- Correlation: High friction in the onboarding phase often correlates with lower NPS scores.
- Tracking: Monitor NPS trends over time to see if journey improvements stabilize loyalty.
3. Sentiment Analysis
Review open-ended feedback, social media mentions, and review sites. Qualitative analysis of text can reveal emerging pain points that quantitative data might miss.
- Keywords: Look for terms like “confusing,” “slow,” “difficult,” or “easy” in relation to specific journey stages.
- Emotion: Map the emotional state of the customer at each touchpoint.
Cost Analysis and Investment 🧮
Calculating ROI requires knowing the cost of the initiative. You cannot determine return without knowing the investment. This includes both direct and indirect costs.
Direct Costs
- Personnel: Hours spent by strategists, designers, and researchers creating and analyzing the maps.
- Tools: Licensing fees for research platforms or collaboration software (if applicable).
- Training: Costs associated with training teams on how to use the maps effectively.
Indirect Costs
- Opportunity Cost: Time spent on mapping is time not spent on other projects.
- Change Management: The effort required to get internal teams to adopt the new processes identified in the map.
The Calculation Framework 📐
Once you have identified your benefits and calculated your costs, you can apply a standard ROI formula. This provides a clear percentage that stakeholders can understand.
ROI Formula:
(Total Benefits – Total Costs) / Total Costs × 100
Here is a breakdown of how to structure this calculation for a typical journey mapping project.
| Component | Description | Example Value |
|---|---|---|
| Total Benefits | Sum of revenue uplift, cost savings, and efficiency gains | $150,000 |
| Total Costs | Personnel hours, tools, and training expenses | $50,000 |
| Net Profit | Benefits minus Costs | $100,000 |
| ROI Percentage | Net Profit divided by Total Costs | 200% |
Ensure that you categorize benefits clearly. Separate one-time savings from recurring revenue to provide a nuanced view of the long-term value.
Attribution Challenges
One of the hardest parts of journey mapping is attributing results to specific changes. Customers interact with multiple channels simultaneously. A sale might be influenced by an email, a website visit, and a store visit.
- Multichannel Attribution: Use multi-touch attribution models to understand which touchpoint contributed most to the conversion.
- A/B Testing: When possible, test changes derived from the map against the original version. This isolates the impact of the journey improvement.
- Control Groups: Compare segments of users who experienced the new journey against those who did not.
Implementation Steps for Measurement 🚀
To ensure accurate tracking, follow a structured approach when implementing measurement protocols.
- Define Success Criteria: Before starting, agree on what success looks like. Is it a 10% reduction in drop-offs? A 5-point increase in NPS?
- Set Up Tracking: Ensure your analytics tools are configured to track the specific events identified in the journey map.
- Document the Baseline: Lock in the pre-implementation data. Do not rely on memory.
- Execute Changes: Roll out the improvements identified by the map.
- Monitor Continuously: Set up dashboards to review metrics weekly or monthly.
- Review and Iterate: Compare actual results against the baseline. Adjust the journey map if results do not meet expectations.
Common Pitfalls to Avoid ⚠️
Even with a solid plan, errors can occur during the measurement process. Being aware of these pitfalls helps maintain data integrity.
1. Confusing Correlation with Causation
Just because a metric improved after a journey change does not mean the change caused it. External factors like seasonality or marketing campaigns might be the drivers.
- Mitigation: Control for external variables. Compare against industry benchmarks.
2. Ignoring the Long Tail
Some benefits of journey mapping take time to surface. Improvements in retention or brand sentiment may not show up in the first quarter.
- Mitigation: Set expectations for long-term tracking. Plan for 6 to 12-month review cycles.
3. Over-Focusing on Vanity Metrics
Page views and session duration are often vanity metrics. They do not always indicate business health. Focus on metrics tied to revenue or cost.
- Mitigation: Tie every metric to a business goal (e.g., revenue, cost, retention).
4. Neglecting Employee Feedback
Internal employees are part of the journey. If the map reveals process changes that frustrate staff, efficiency may drop even if customer metrics improve.
- Mitigation: Include internal journey mapping to measure employee experience alongside customer experience.
Long-term Value Tracking 📈
ROI is not a one-time calculation. It is an ongoing process of validation. As the business evolves, so do the customer journeys. Continuous tracking ensures the map remains relevant.
Quarterly Reviews
Schedule regular reviews with stakeholders to present the latest data. This keeps the initiative visible and ensures continued support.
- Reporting: Use visual dashboards to show trends over time.
- Discussion: Discuss any deviations from the expected trajectory.
Annual Audits
Once a year, conduct a full audit of the journey maps and the associated metrics. Verify that the baseline data is still accurate and that new pain points have not emerged.
- Updates: Refresh the maps to reflect new products, services, or channels.
- Strategy: Align the journey goals with the broader annual business strategy.
Reporting to Stakeholders 📢
How you present the data is just as important as the data itself. Stakeholders need clear, concise, and actionable insights.
- Start with the Bottom Line: Lead with the financial impact. State the ROI percentage clearly.
- Contextualize the Data: Explain what the numbers mean for the customer. A 10% lift in conversion might mean 1,000 more happy customers.
- Highlight Successes: Showcase specific wins from the project. Use case studies or specific examples.
- Identify Gaps: Be honest about areas where the journey still needs work. This builds trust and highlights future opportunities.
Final Thoughts on Measurement 💡
Measuring the ROI of customer journey mapping requires discipline and a commitment to data integrity. It involves blending quantitative hard data with qualitative insights to form a complete picture of performance.
By establishing a solid baseline, tracking the right metrics, and maintaining a clear cost analysis, organizations can demonstrate the tangible value of their journey initiatives. This approach moves the conversation from abstract concepts to concrete business outcomes.
Remember that journey mapping is a cycle, not a destination. As you measure and improve, you gain deeper insights into your customers. This continuous loop of mapping, measuring, and optimizing ensures long-term competitiveness and customer loyalty.
Focus on the data you control, communicate clearly with your team, and let the numbers drive your decisions. The return on investment will follow as a natural result of a customer-centric strategy.

