Customer churn is a silent challenge for businesses of all sizes. It often happens gradually, driven by small frustrations that accumulate over time. When customers leave, it is rarely due to a single catastrophic event. Instead, it is usually the result of a disjointed experience across multiple touchpoints. To stop these losses, organizations must visualize the entire customer lifecycle. This is where detailed journey mapping becomes essential. By understanding the path your customers take, you can identify friction points before they lead to attrition.
This guide explores how to leverage customer journey maps to reduce churn effectively. We will examine the mechanics of churn, the anatomy of a journey map, and practical steps to implement a retention-focused strategy. There are no shortcuts here, just a structured approach to improving customer experience and securing long-term revenue.
Understanding the Cost and Cause of Churn 💸
Before applying any solution, one must understand the problem. Churn, or customer attrition, represents the percentage of customers who stop doing business with an entity over a specific period. The financial impact is twofold: the loss of recurring revenue and the cost of acquiring a replacement customer.
The Hidden Drivers of Attrition
Many businesses focus on acquisition metrics while neglecting retention. They assume new signups offset departures. However, retention is often more profitable. When churn occurs, it signals a breakdown in the value proposition or the user experience. Common drivers include:
- Poor Onboarding: Customers fail to see value quickly enough.
- Unresponsive Support: Issues go unresolved, leading to frustration.
- Feature Gaps: The product does not solve a critical problem.
- Price Sensitivity: The perceived value does not match the cost.
- Lack of Engagement: Customers forget the product exists.
Without a map of the customer journey, these issues remain invisible until the customer has already submitted a cancellation request. A journey map reveals the timeline of these interactions.
What is a Customer Journey Map? 📊
A customer journey map is a visual representation of the steps a customer takes to achieve a goal with your organization. It is not just a flowchart. It incorporates emotional states, pain points, and channels used at every stage. It connects the “what” (actions) with the “how” (feelings).
Key Components of a Journey Map
To make a map useful for churn reduction, it must contain specific data layers:
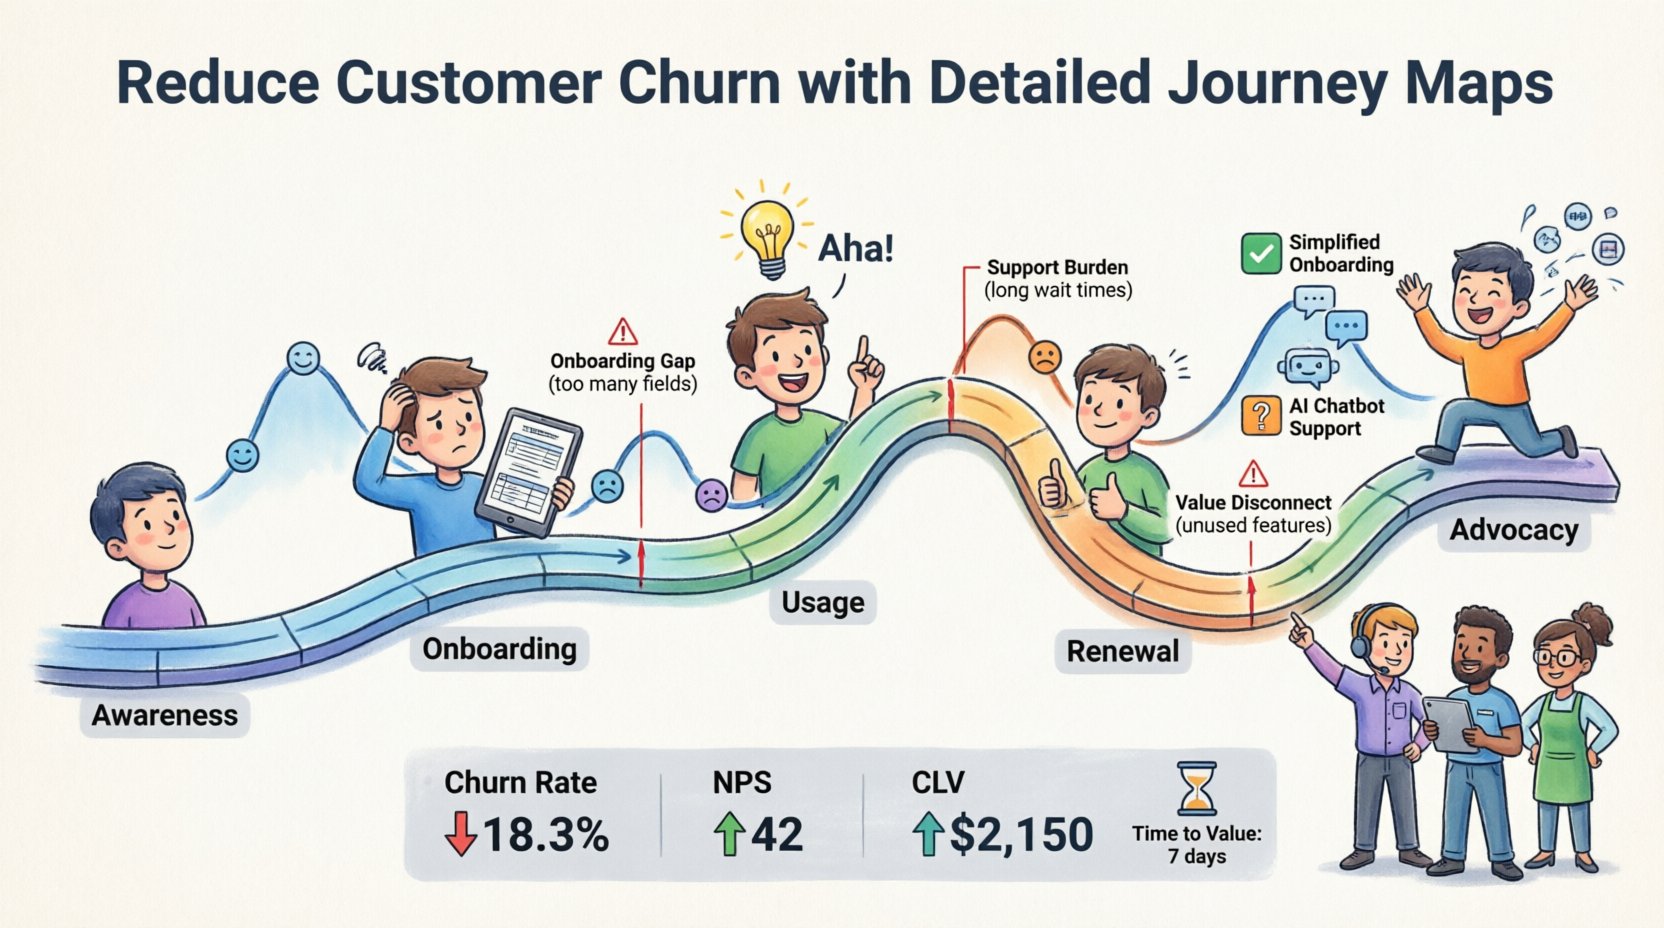
- Phases: The high-level stages of the relationship (e.g., Awareness, Onboarding, Usage, Renewal).
- Touchpoints: Specific interactions (e.g., Email, Phone Call, Dashboard Login).
- Actions: What the customer is doing at that moment.
- Emotions: How the customer feels (frustrated, happy, confused).
- Opportunities: Areas where you can improve the experience.
When built correctly, this document serves as a single source of truth for product, support, and marketing teams.
Connecting Maps to Retention Strategies 🤝
How does a map actually stop someone from leaving? The answer lies in the identification of drop-off points. Churn rarely happens randomly. It clusters around specific moments in the lifecycle where the experience falters. A detailed map allows you to pinpoint these clusters.
1. The Onboarding Gap
The highest risk period is often the first few days after signing up. If a user does not achieve a “Aha! moment” quickly, they are likely to churn. A journey map highlights the steps required to reach this moment. If the path is too long or complex, the map shows exactly where to simplify.
2. The Support Burden
High volume of support tickets is a leading indicator of churn. By mapping the support journey, you can see if customers are looping between channels without resolution. If a customer has to explain their issue three times, the journey map flags this as a critical friction point.
3. The Value Disconnect
Sometimes, customers pay but do not use the product. A journey map can reveal if the messaging promises features that the user interface hides. Aligning the map with actual usage data helps close this gap.
Step-by-Step Guide to Creating a Churn-Focused Map 🛠️
Creating a map is a collaborative effort. It requires data from sales, support, and product teams. Follow this structured process to build a map that drives retention.
Step 1: Gather Quantitative and Qualitative Data
Start with facts. Look at analytics to see where users drop off. Then, look at feedback. Use surveys, support transcripts, and interview recordings. You need both numbers and stories. Numbers tell you what happened; stories tell you why.
Step 2: Define Your Customer Personas
Not all customers have the same journey. A power user might skip setup steps that a novice user needs. Define distinct personas based on demographics, behaviors, and goals. Map the journey for each persona separately if they differ significantly.
Step 3: Outline the Phases and Touchpoints
Break the relationship down into chronological phases. Common phases include:
- Awareness and Discovery
- Consideration and Purchase
- Onboarding and Activation
- Regular Usage and Value Realization
- Renewal and Advocacy
For each phase, list every touchpoint. This includes emails, ads, landing pages, app screens, and support interactions.
Step 4: Map the Emotional Curve
This is the most critical step for churn reduction. Ask users or support staff to rate the emotion at each touchpoint on a scale from negative to positive. Where does the line dip? These are your churn risks. A dip during the billing phase indicates pricing confusion. A dip during the login phase indicates technical issues.
Step 5: Identify Friction Points
Review the emotional curve alongside the operational data. Look for:
- High effort required from the user.
- Long wait times between steps.
- Confusing terminology.
- Broken links or error messages.
Common Friction Points and Solutions 📋
The following table illustrates typical friction points found in customer journeys and how they relate to churn. Use this as a reference to audit your own maps.
| Phase | Friction Point | Customer Emotion | Impact on Churn | Potential Solution |
|---|---|---|---|---|
| Onboarding | Too many mandatory fields | Frustrated | High | Reduce fields to essentials; use progressive profiling. |
| Support | Long hold times | Anxious | High | Implement chatbots for quick answers; add callback options. |
| Billing | Unclear pricing structure | Confused | Medium | Clarify invoices; add FAQs about charges. |
| Usage | Complex navigation | Overwhelmed | Medium | Simplify UI; add tooltips or guided tours. |
| Renewal | No proactive reminders | Neglected | High | Send usage summaries and renewal offers early. |
Strategies to Address Friction and Retain Users 🚀
Once the map is complete, you have a roadmap for action. Here are specific tactics to implement based on your findings.
1. Proactive Communication
Don’t wait for the customer to ask. If the journey map shows confusion at a specific step, send a proactive message. For example, if users often get stuck during API integration, send a tutorial video automatically when they reach that stage. Anticipating needs reduces friction.
2. Personalized Engagement
Generic messages often get ignored. Use data to tailor communication. If a user hasn’t logged in for two weeks, trigger a win-back campaign. If they are a heavy user, invite them to a beta feature. The journey map tells you who they are and what they need at that moment.
3. Optimize the Exit Path
Sometimes churn is inevitable. However, how you handle it matters. If a customer requests cancellation, offer a pause, a discount, or a change in plan instead of a hard stop. This keeps the door open for the future. Map the cancellation flow just as you do the purchase flow.
4. Close the Feedback Loop
Ensure that customer feedback actually changes the product. If users complain about a feature repeatedly, acknowledge it and update the roadmap. When customers see their input leads to action, loyalty increases. Display a changelog or a “You asked, we built” section.
Measuring Success and Impact 📈
After implementing changes based on your journey map, you must measure the results. Use the following metrics to track progress:
- Customer Churn Rate: The percentage of customers lost. Aim for a downward trend.
- Net Promoter Score (NPS): Measures loyalty and satisfaction.
- Customer Lifetime Value (CLV): Indicates if retained customers are generating more revenue.
- Time to Value: How long it takes a new user to realize the core benefit.
- Support Ticket Volume: A reduction here indicates fewer friction points.
Track these metrics monthly. Compare them against the baseline established before the journey mapping project began. This data validates the investment in experience optimization.
Common Pitfalls to Avoid ⚠️
While journey mapping is powerful, teams often stumble in execution. Be aware of these common mistakes.
- Assuming the Map is Static: Customer behavior changes. A map created today might be obsolete in six months. Treat it as a living document.
- Ignoring Internal Friction: Sometimes the customer journey breaks because internal teams are siloed. Ensure marketing, sales, and support share the same map.
- Focusing Only on the Happy Path: Maps often show the ideal scenario. You must also map the “unhappy path” where things go wrong.
- Lack of Stakeholder Buy-in: If leadership does not understand the map, they won’t fund the fixes. Share insights widely.
Maintaining the Journey Map Lifecycle 🔄
To sustain churn reduction, you must maintain the map. This requires a governance process.
Quarterly Reviews
Schedule a review every quarter. Check if new features have altered the journey. Update the emotional curve based on recent feedback. Ensure the map reflects the current reality, not the past.
Integration with Product Roadmap
Link the journey map directly to your product backlog. When a friction point is identified, create a ticket to fix it. This ensures that journey insights translate into actual development work.
Cross-Functional Workshops
Hold workshops where different departments walk through the map together. This breaks down silos. When support sees what marketing promises, and sales sees what product delivers, alignment improves. This alignment is critical for a seamless customer experience.
Final Considerations for Retention 🧠
Reducing churn is not a one-time project. It is an ongoing discipline. By using detailed journey maps, you shift from guessing why customers leave to knowing exactly where the breakdown occurs. This knowledge allows you to intervene before it is too late.
The process requires effort. It demands honesty about where you are failing. It requires collaboration across the organization. However, the return on investment is clear. Retained customers are cheaper to serve and more valuable over time. They also become advocates who bring in new business.
Start by auditing your current customer path. Identify the first major friction point. Create a map for that specific segment. Implement a fix. Measure the result. Repeat. This iterative approach builds a resilient business capable of weathering market shifts. Your customers will notice the improvement. They will stay longer. And your revenue will grow.
Remember, the goal is not just to keep them for today, but to build a relationship that lasts. Detailed journey maps provide the blueprint for that longevity. Use them wisely.

