


In the landscape of software development and product management, clarity often remains the most elusive resource. Teams frequently find themselves buried under piles of tasks, disconnected requirements, and a backlog that feels more like a graveyard of ideas than a roadmap to success. This is where User Story Mapping emerges as a critical discipline. It transforms abstract lists into a visual narrative, aligning teams around the user experience rather than just feature delivery. 📝
This guide explores the mechanics, benefits, and practical application of User Story Mapping. It serves as a foundational resource for Product Owners, Scrum Masters, and development teams seeking to streamline their Agile processes. By understanding how to structure work visually, organizations can ensure that every line of code contributes directly to user value. 🚀
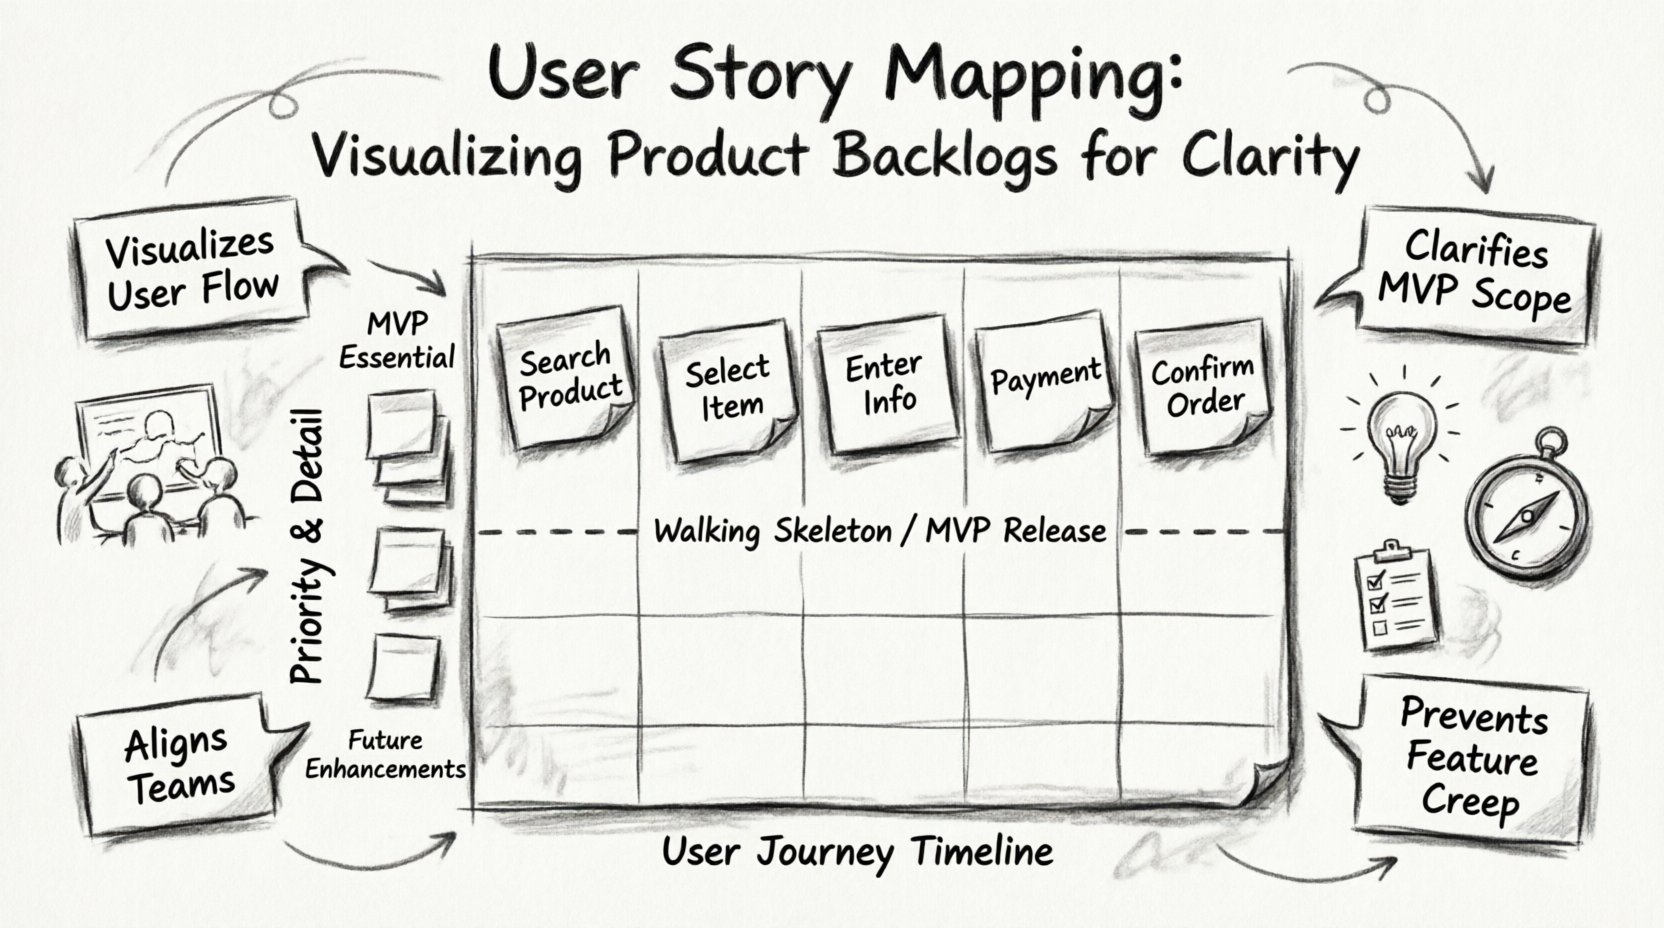
🧩 What Is User Story Mapping?
User Story Mapping is a collaborative exercise that helps teams understand the user journey and organize product requirements into a structured map. Unlike a traditional backlog, which is often a linear list of items, a story map arranges work in two dimensions: horizontal and vertical.
Horizontal Axis: Represents the user journey over time. This includes activities, steps, and the flow of the user through the product.
Vertical Axis: Represents priority and detail. Higher items on the map are critical for the Minimum Viable Product (MVP), while lower items represent enhancements or future possibilities.
The concept was popularized by Jeff Patton to help teams visualize the “big picture” while still managing the details required for execution. It bridges the gap between high-level strategy and low-level implementation tasks. When done correctly, the map becomes a single source of truth for what the product should be and how it will evolve. 🧱
🎯 Why Traditional Backlogs Fail to Provide Clarity
Before diving into the solution, it is necessary to understand the problem with standard backlog management. In many organizations, the Product Backlog is treated as a prioritized list of tickets. While useful for tracking, this format has significant limitations.
Loss of Context: When a story is isolated, its relationship to other features is often lost. Developers may build a feature in isolation without understanding how it fits into the user flow.
Feature Creep: Without a visual structure, it is easy to add features that do not support the core user goal. The backlog becomes a wish list rather than a plan.
Difficulty in Release Planning: Determining what can be shipped in a specific sprint or release becomes a guessing game. Teams often struggle to identify the “walking skeleton” or the minimal set of features required to deliver value.
Communication Gaps: Stakeholders often find it difficult to visualize the product vision from a list of technical tickets. The narrative is fragmented.
User Story Mapping addresses these issues by reordering the backlog based on user needs rather than technical dependencies or arbitrary priority scores. It forces the team to think about the story of the product, not just the tasks. 🧵
🏗️ Anatomy of a Story Map
To build an effective map, one must understand the components that make up the grid. While the visual layout can vary, the core elements remain consistent across Agile teams.
1. The Backbone (Activities)
The top row of the map represents the major activities or high-level steps a user takes to achieve a goal. These are not technical tasks but user actions. For example, in an e-commerce application, the backbone might include:
Search for Product 🔍
Select Product 🛒
Enter Shipping Info 📦
Make Payment 💳
Confirm Order 📝
2. User Stories (Tasks)
Directly beneath each activity are the specific user stories. These break down the activities into manageable increments. They answer the question: “What specifically does the user need to do within this activity?”.
3. Prioritization (Slices)
The vertical arrangement indicates priority. The stories at the top of each column are the most essential for the first release. As you move down the column, the features become less critical or are intended for future iterations. This allows teams to define the MVP clearly.
4. The Walking Skeleton
This concept refers to the horizontal slice across the map that connects all backbone activities with the minimum functionality required to execute the flow. It is the first version of the product that delivers end-to-end value. 🦴
🛠️ The Process of Creating a Map
Creating a User Story Map is not a solitary task. It is a workshop activity that requires the involvement of the entire team, including developers, designers, and stakeholders. The process typically follows these steps.
Step 1: Define the User Journey
Start by identifying the primary persona and their goal. Write the backbone activities on sticky notes or digital cards. Arrange them chronologically from left to right. This ensures the team agrees on the flow of the experience. 🧭
Step 2: Brainstorm Stories
Once the backbone is set, the team brainstorms the specific stories that fall under each activity. These are placed vertically under the corresponding activity. Do not worry about priority yet. The goal is to get all ideas out of the heads of the participants and onto the map. 💡
Step 3: Prioritize and Slice
Now, arrange the stories vertically. The most critical stories go at the top. Cut a horizontal line across the map to define the MVP. Everything above this line is in scope for the first release. Everything below is for the backlog. 📉
Step 4: Refine and Estimate
Once the scope is defined, refine the stories to ensure they meet acceptance criteria. Estimate the effort required for each story. This helps in capacity planning for upcoming sprints. 📊
📊 Comparing Backlog Formats
To understand the value of mapping, it helps to compare it with traditional list-based backlogs. The table below outlines the key differences in structure, focus, and utility.
Feature | Traditional Backlog (List) | User Story Map |
|---|---|---|
Structure | Linear list of items | 2D Grid (Journey x Priority) |
Focus | Feature delivery | User experience & Flow |
Release Planning | Difficult to define MVP | Clear horizontal slicing for MVP |
Context | Low; items are isolated | High; relationships are visible |
Team Alignment | Varies; often siloed | High; collaborative workshop |
Flexibility | Hard to see impact of changes | Easy to move items between releases |
🔄 Integrating the Map with Sprints
Once the map is created, how does it translate into daily work? The map serves as the strategic layer, while sprints are the tactical execution. The team pulls stories from the map into the sprint backlog based on the vertical priority.
Sprint Goals: The sprint goal should align with a specific section of the map. If the team is working on the “Payment” activity, the sprint goal might be “Enable secure checkout flow”.
Progress Tracking: As stories are completed, they can be visually marked on the map. This provides a clear view of progress across the entire journey, not just within a single feature.
Dynamic Adjustment: If new requirements emerge, the team can add them to the map. If priorities shift, they can move stories up or down without breaking the flow of the user journey.
This integration ensures that the team never loses sight of the product vision while managing the granular details of development. It prevents the common pitfall of sprinting efficiently towards the wrong destination. 🏁
⚠️ Common Pitfalls and How to Avoid Them
While User Story Mapping is powerful, it is not immune to misuse. Teams often encounter specific challenges that can reduce the effectiveness of the practice. Recognizing these pitfalls early is essential for success.
1. Focusing Too Much on Details
A common mistake is creating a map that is too granular too quickly. If you spend weeks detailing every single click and button, the map becomes a specification document rather than a planning tool. 🚫
Solution: Keep the initial map high-level. Use the map to identify the MVP, then refine the details of individual stories during sprint planning.
2. Ignoring the User
Sometimes the map becomes a list of technical tasks disguised as user stories. If the backbone consists of “Database Schema” or “API Setup”, the map has failed. It must remain focused on the user’s perspective. 👤
Solution: Review every activity. Ask, “Does the user care about this?” If the answer is no, move it to the “Infrastructure” column or a separate technical backlog.
3. Creating a Static Document
The map should never be considered finished. Products evolve, and user needs change. A map that sits on a shelf is a liability. 📚
Solution: Treat the map as a living artifact. Review it regularly during backlog refinement sessions. Update it as new insights are gained from user feedback.
4. Lack of Collaboration
If the Product Owner creates the map alone, it lacks the buy-in of the development team. The map loses its power as a shared understanding tool. 🤝
Solution: Involve developers, QA, and designers in the workshop. Their technical constraints and insights are vital for a realistic map.
📈 Scaling and Advanced Applications
As organizations grow, the need for scalability becomes apparent. A single map may not be enough for large, complex products with multiple teams. Here are strategies for scaling the practice.
Multiple Maps: Instead of one giant map, create separate maps for different domains (e.g., User Onboarding, Checkout, Reporting). Link them through shared user goals.
Program Increments: For larger frameworks, use the map to define themes across multiple sprints or Program Increments. This helps in aligning long-term goals with short-term execution.
Dependency Management: The map makes dependencies visible. If Team A needs a feature from Team B to complete a backbone activity, the visual layout highlights this risk immediately. 🕸️
💡 The Psychological Benefit of Visualization
There is a cognitive advantage to using a visual map over a list. Human brains are wired to recognize patterns and spatial relationships. When information is presented visually, it reduces cognitive load. 🧠
When a team looks at a list, they see items. When they look at a map, they see a story. This shift in perspective changes the conversation. Instead of asking “What are we building next?”, the team asks “How does this feature help the user complete this activity?”. This alignment on value is the true power of the technique.
Furthermore, the map reduces the fear of the unknown. A long list of requirements can be intimidating. A map shows the path forward in segments. It makes the project feel manageable and achievable. This confidence boosts team morale and productivity. 🌟
🔍 Maintenance and Continuous Improvement
Maintaining the map requires discipline. It is not enough to create it once at the start of a project. It must be integrated into the Agile rhythm.
Backlog Refinement: Use refinement sessions to update the map. Move completed stories down or mark them as done. Add new stories based on feedback.
Retrospectives: Discuss what parts of the map were difficult to implement. This provides data on where the process needs improvement.
Stakeholder Reviews: Show the map to stakeholders regularly. It is easier for them to understand progress on a map than a spreadsheet. This builds trust and transparency. 🤝
🛠️ Tools and Materials
While software tools exist, the essence of User Story Mapping lies in the collaboration, not the platform. You can start with physical sticky notes and a whiteboard. This tactile approach encourages movement and physical engagement with the content. 📌
If a digital environment is necessary, look for tools that support drag-and-drop functionality and large canvases. However, be wary of tools that enforce rigid structures. The tool should adapt to the team, not the team to the tool. The goal is flexibility. 🖥️
📝 Summary of Best Practices
To ensure success with User Story Mapping, adhere to these core principles.
Keep it Simple: Avoid over-complicating the initial map. Start with the backbone.
Focus on Value: Ensure every item on the map delivers value to the user.
Collaborate: Involve the whole team in the mapping process.
Iterate: Treat the map as a living document that evolves with the product.
Visualize the MVP: Clearly define the horizontal slice that represents the first release.
Communicate: Use the map as a communication tool for stakeholders and the team.
By adopting this approach, teams move away from reactive task management and towards proactive product planning. The backlog ceases to be a burden and becomes a strategic asset. 🏆
🌐 The Future of Product Planning
As the industry shifts towards more product-centric delivery models, the need for visual context grows. Agile frameworks continue to evolve, but the fundamental need to understand user flow remains constant. User Story Mapping provides a stable foundation amidst the changing tools and methodologies.
It reminds teams that technology is a means to an end. The end is the user. By keeping the user journey at the center of the planning process, organizations ensure they are building products that matter. This focus on clarity and value is what drives sustainable growth and customer satisfaction. 📈
Implementing User Story Mapping requires a shift in mindset, but the return on investment in terms of clarity, alignment, and efficiency is substantial. It is a practice worth investing in for any team serious about delivering quality software. 🛠️

