


Strategic planning relies heavily on accurate frameworks to map the competitive landscape. Porter’s Five Forces remains a cornerstone for understanding industry profitability and positioning. However, practitioners often encounter a scenario where the output of their analysis does not align with market reality. This dissonance can lead to flawed strategies, misallocated resources, and missed opportunities. When the numbers do not match the narrative, it is time to troubleshoot the methodology.
This guide addresses the specific friction points that occur when applying Porter’s framework. It moves beyond the textbook definition to focus on the practical application, data validation, and cognitive checks required to ensure the analysis holds weight. We will examine each force individually, identify common errors, and provide actionable corrections. The goal is to transform a static worksheet into a dynamic tool for strategic insight.
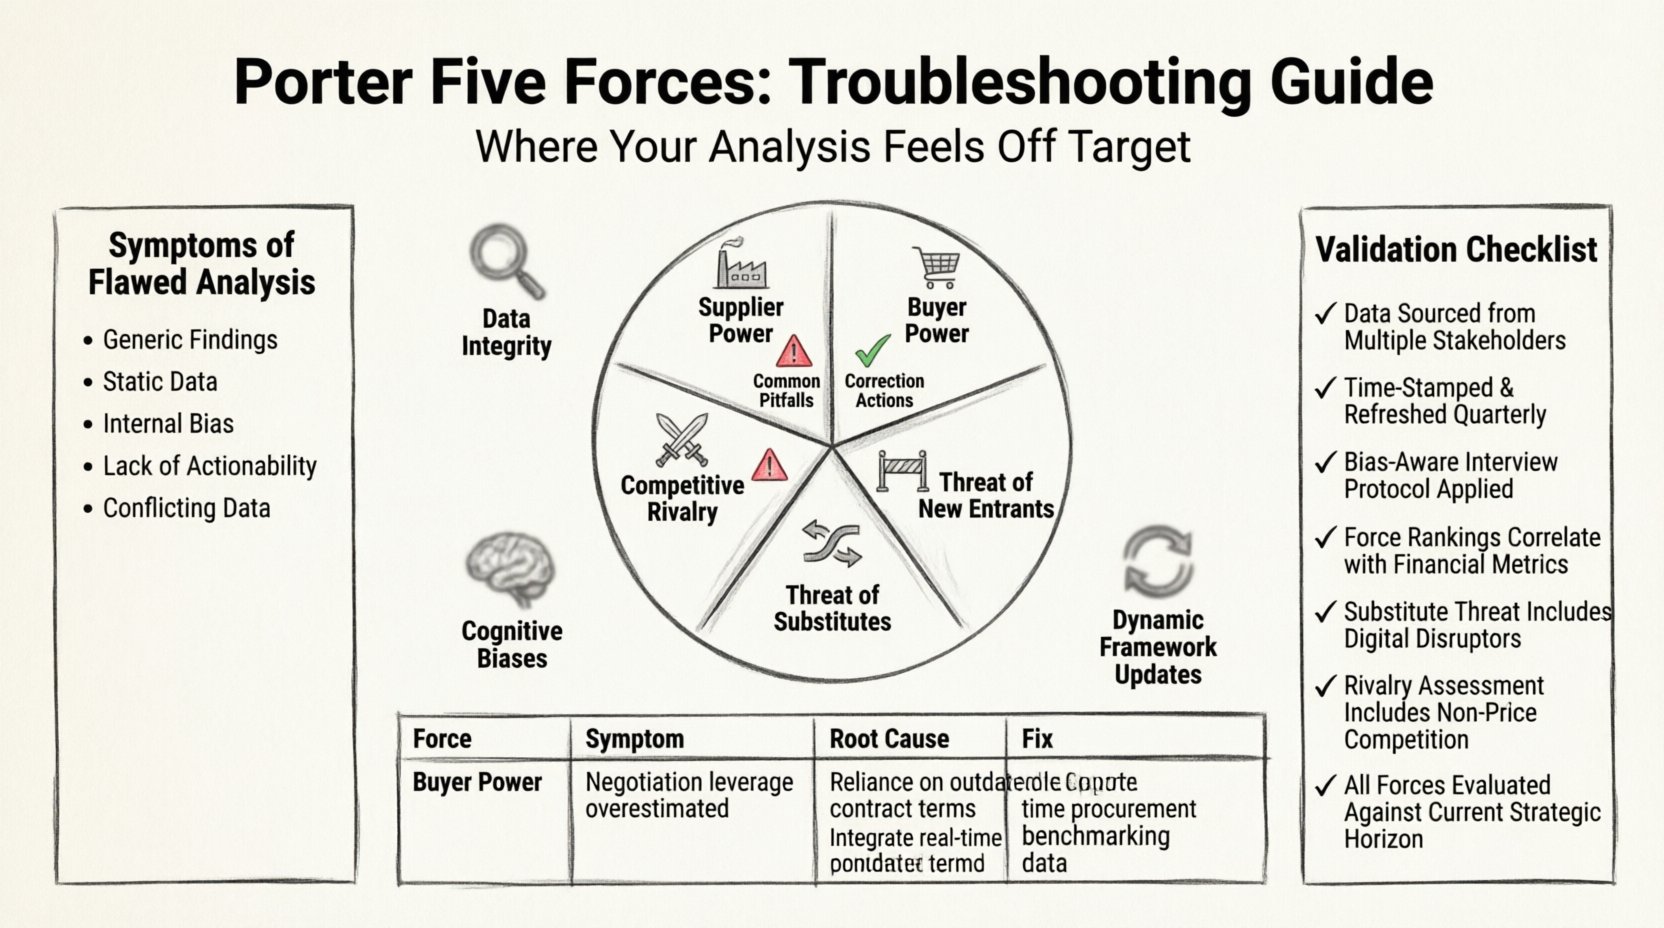
🚩 Recognizing the Symptoms of a Flawed Analysis
Before diving into the technical fixes, one must recognize the warning signs. An analysis that feels off often exhibits specific characteristics that indicate underlying structural issues. These symptoms suggest that the model is being applied mechanically rather than contextually.
- Generic Findings: The conclusions apply to almost any industry without specific nuance.
- Static Data: The information used is outdated or does not reflect recent market shifts.
- Internal Bias: The analysis seems designed to confirm pre-existing beliefs rather than challenge them.
- Lack of Actionability: The output describes the situation but offers no clear path for strategic response.
- Conflicting Data Points: Different sources provide contradictory information without resolution.
Identifying these symptoms early prevents the compounding of errors in subsequent planning stages. It requires a willingness to step back and question the inputs that feed the framework.
🏭 Troubleshooting Supplier Power
Supplier power assesses the ability of providers to drive up prices or reduce the quality of purchased goods and services. A common error here is assuming all suppliers are equal or overlooking the cost of switching.
Common Pitfalls
- Overlooking Concentration: Focusing on the number of suppliers rather than their market share concentration.
- Ignoring Switching Costs: Failing to quantify the financial or operational friction of changing vendors.
- Missing Forward Integration: Neglecting the threat of suppliers entering the buyer’s industry as competitors.
- Static Pricing Models: Assuming price stability without accounting for inflation or raw material volatility.
Correction Actions
- Analyze the concentration ratio of the top three suppliers in the sector.
- Conduct a cost-benefit analysis of vendor switching, including training and integration time.
- Review supplier financial statements to assess their vertical integration strategies.
- Establish long-term contracts or hedging mechanisms where volatility is high.
🛒 Troubleshooting Buyer Power
Buyer power evaluates the pressure customers can exert on a business to lower prices or improve quality. This force is often misunderstood as simply looking at who the customers are, rather than their leverage dynamics.
Common Pitfalls
- Confusing Volume with Leverage: High purchase volume does not always equal high bargaining power if the product is unique.
- Ignoring Price Sensitivity: Failing to measure the elasticity of demand for the specific product category.
- Neglecting Information Access: Overlooking how much market transparency buyers have regarding competitors.
- Assuming Loyalty: Assuming customer retention is guaranteed without continuous value delivery.
Correction Actions
- Segment customers by their specific sensitivity to price changes.
- Map the availability of substitute products from the customer’s perspective.
- Measure the cost to the customer if they switch to a competitor.
- Identify channels where customer concentration is highest and address them specifically.
🚧 Troubleshooting Threat of New Entrants
This force looks at the ease with which new competitors can enter the market. It is frequently miscalculated due to an overestimation of barriers to entry or underestimating disruptive technologies.
Common Pitfalls
- Focus on Capital Only: Ignoring regulatory hurdles, intellectual property, or network effects.
- Static Barriers: Assuming barriers that exist today will exist in five years.
- Ignoring Adjacent Markets: Failing to see how competitors from related industries can pivot easily.
- Underestimating Agility: Underestimating how fast a new entrant can scale compared to an incumbent.
Correction Actions
- Conduct a regulatory impact assessment for new market participants.
- Review patent filings and technology trends that lower entry costs.
- Monitor startups in adjacent sectors that share similar technology stacks.
- Test the speed of customer acquisition for new entrants in the current cycle.
🔄 Troubleshooting Threat of Substitutes
Substitutes are products or services from outside the industry that fulfill the same need. This is often the most difficult force to identify because it requires thinking beyond the industry boundaries.
Common Pitfalls
- Defining the Product Too Narrowly: Focusing on the physical product rather than the customer need.
- Ignoring Price-Performance: Overlooking substitutes that offer lower performance at a significantly lower cost.
- Neglecting Behavioral Shifts: Failing to account for changing consumer habits or technology adoption.
- Static Comparison: Comparing current substitutes rather than emerging ones.
Correction Actions
- Conduct a “Jobs to be Done” analysis to understand the underlying customer need.
- Survey customers on alternative solutions they use outside the primary category.
- Monitor price-performance ratios across different industries.
- Track adoption rates of emerging technologies that solve the same problem.
⚔️ Troubleshooting Competitive Rivalry
Competitive rivalry measures the intensity of competition among existing firms. It is often confused with market share battles rather than the structural drivers of conflict.
Common Pitfalls
- Focus on Price Wars: Assuming rivalry is only about price, ignoring service or innovation.
- Ignoring Exit Barriers: Failing to see how high exit costs keep inefficient competitors in the market.
- Overlooking Growth Rates: Neglecting how a stagnant market increases conflict over market share.
- Assuming Homogeneity: Assuming all competitors are identical in strategy and capability.
Correction Actions
- Analyze the fixed costs and capacity utilization of key rivals.
- Map the strategic intent and growth goals of major competitors.
- Identify non-price competitive factors like brand equity or service levels.
- Review the industry’s maturity stage and historical consolidation trends.
📊 Diagnostic Table: Force vs. Symptom vs. Fix
The following table summarizes the troubleshooting logic for quick reference during the review process.
| Force | Common Symptom | Root Cause | Correction Action |
|---|---|---|---|
| Supplier Power | Prices seem stable but margins shrink | Hidden costs or indirect supplier leverage | Map total cost of ownership |
| Buyer Power | Customers demand discounts frequently | Low switching costs or high transparency | Increase differentiation value |
| New Entrants | Unexpected competitors appear | Underestimated tech disruption | Monitor adjacent tech sectors |
| Substitutes | Adoption drops despite good product | Alternative solutions emerged | Conduct needs-based analysis |
| Rivalry | Market share battles intensify | Industry saturation or high exit barriers | Assess consolidation potential |
📉 Data Integrity and Sources
The quality of the analysis is directly tied to the quality of the data. Inaccurate inputs lead to the “off-target” feeling. Relying on a single source or outdated reports is a frequent cause of drift.
- Primary Research: Direct interviews with customers, suppliers, and industry experts provide ground truth.
- Secondary Research: Industry reports, financial filings, and trade publications offer breadth but need verification.
- Internal Data: Historical sales data and customer feedback loops are critical for validation.
- Market Signals: Mergers, acquisitions, and leadership changes often precede structural shifts.
Ensure that data points are triangulated. If a statistic appears in one report, verify it against at least two other independent sources. Discrepancies often highlight areas where the market reality differs from the reported narrative.
🧠 Cognitive Biases in Strategic Planning
Human judgment plays a significant role in interpreting the forces. Even with perfect data, cognitive biases can skew the output. Recognizing these mental traps is essential for troubleshooting.
- Confirmation Bias: Seeking information that supports the initial hypothesis while ignoring contradictory evidence.
- Recency Bias: Giving too much weight to recent events over long-term trends.
- Survivorship Bias: Focusing only on successful competitors and ignoring those that failed and why.
- Anchoring: Relying too heavily on the first piece of information encountered when making decisions.
To mitigate these biases, assign a “devil’s advocate” role within the planning team. This person is responsible for challenging the consensus and forcing the team to justify assumptions with hard evidence. Rotate this role to prevent groupthink from solidifying.
🔄 Keeping the Framework Dynamic
Porter’s framework was developed in a specific historical context. Markets evolve, and the forces shift. A static analysis becomes obsolete quickly. Regular updates are necessary to maintain accuracy.
- Quarterly Reviews: Check for significant changes in supplier contracts or customer behavior.
- Annual Deep Dives: Re-evaluate barriers to entry and substitute technologies every year.
- Trigger Events: Initiate a full review upon major regulatory changes, economic shifts, or disruptive tech launches.
- Scenario Planning: Develop multiple versions of the analysis based on different future states.
Documenting the rationale for each rating helps in future reviews. If you rate a force as “High” today, note the specific drivers. When reviewing next year, compare the actual drivers to the original list to see if the landscape has shifted.
✅ Final Checklist for Validation
Before finalizing the strategic plan, run through this validation checklist to ensure the analysis is robust and ready for execution.
- Have all five forces been evaluated independently?
- Is the data used current and from multiple sources?
- Have cognitive biases been actively challenged?
- Does the analysis account for external macroeconomic factors?
- Are the findings specific to the company’s context?
- Is there a clear link between the analysis and the proposed strategy?
- Have the assumptions been documented for future tracking?
A well-troubled analysis provides a solid foundation for decision-making. It does not guarantee success, but it significantly reduces the risk of navigating blind. By addressing the common pitfalls outlined above, organizations can ensure their strategic planning is grounded in reality rather than speculation.
🔗 Integrating Insights into Strategy
The final step is translating the corrected analysis into action. A diagnosis without treatment is incomplete. The insights gathered from troubleshooting should directly inform resource allocation and operational priorities.
- High Supplier Power: Diversify the supply chain or invest in vertical integration.
- High Buyer Power: Increase switching costs through loyalty programs or customization.
- High Entrant Threat: Build moats through IP or scale advantages.
- High Substitute Threat: Focus on customer experience and brand loyalty.
- High Rivalry: Differentiate on value rather than price.
Strategic agility depends on the accuracy of the underlying model. When the model is trusted, the organization can move with confidence. When the model is suspect, resources are wasted on fixing the wrong problems. This guide aims to help you fix the model so the strategy can succeed.

