
From Chaos to Clarity: Mastering Flowcharts with Visual Paradigm AI and VPasCode
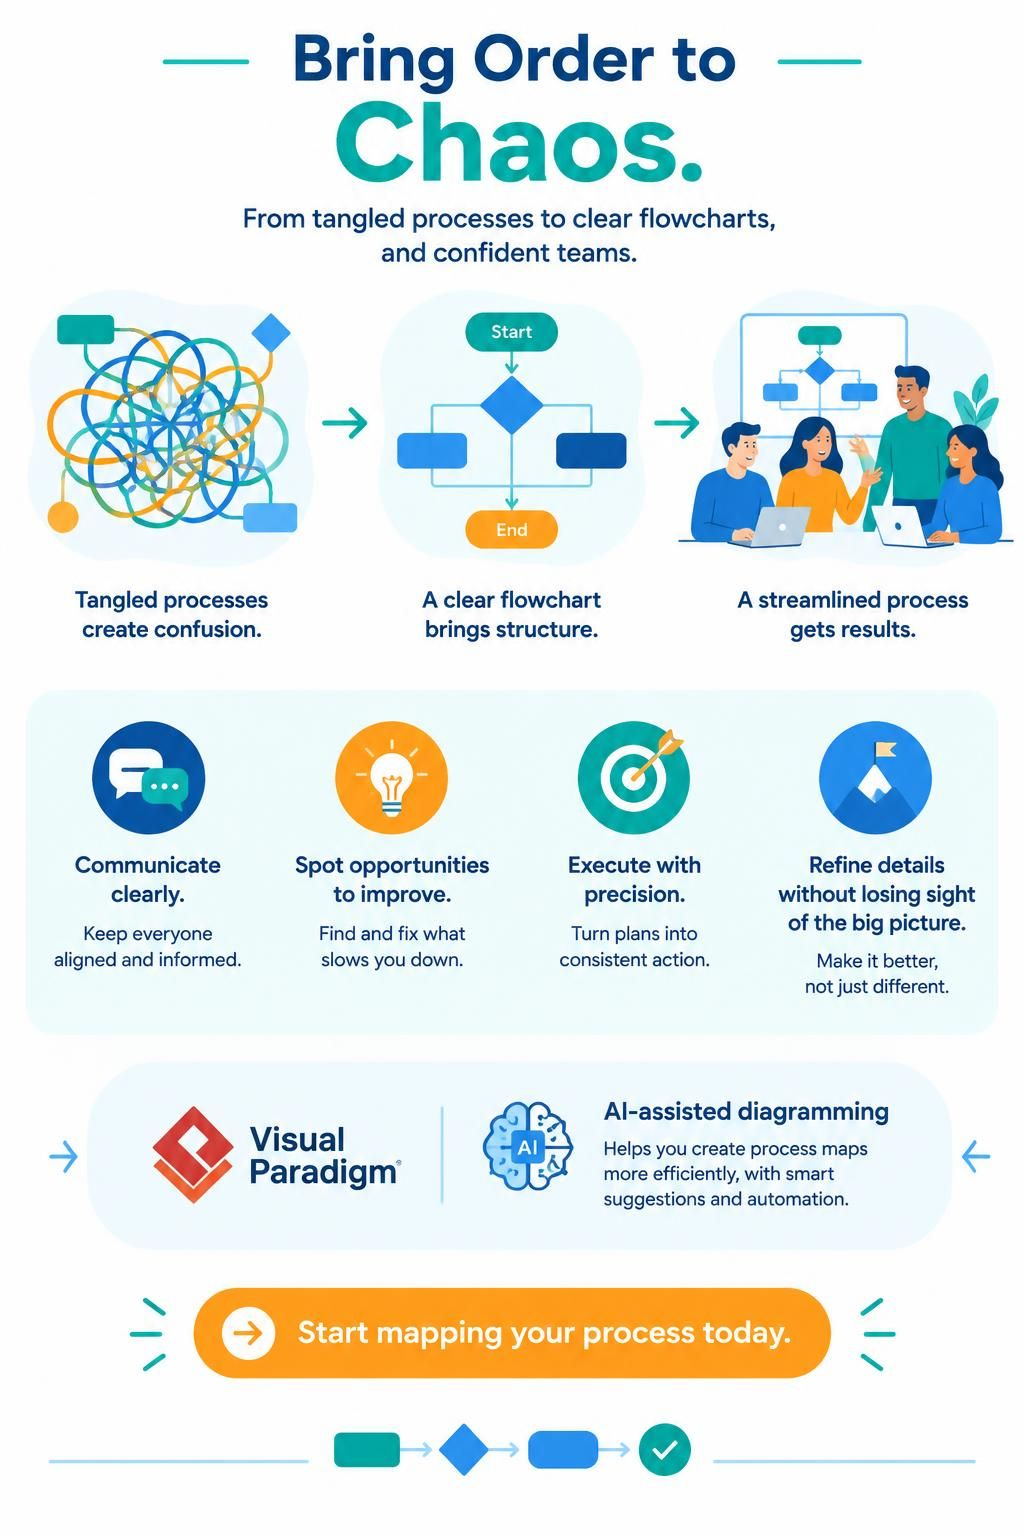
In the complex landscape of modern business operations, information overload often leads to process paralysis. When workflows become tangled, decision-making slows, and efficiency plummets. This is where the art and science of process mapping come into play. By transforming abstract ideas into visual representations, organizations can bring order to chaos, ensuring that every stakeholder understands the “how” and “why” behind their work.
This tutorial explores how to leverage Visual Paradigm’s advanced ecosystem—including its AI capabilities and the VPasCode tool—to design high-quality, structured flowcharts. We will move beyond simple drawing and explore the architectural thinking required to model processes effectively.
The Philosophy of Visualizing Process
Why do we diagram? It is not merely about creating a picture for a presentation. The primary goal of a flowchart is to act as a universal language. It serves three critical functions:
- Communication: A visual diagram eliminates the ambiguity of text. It keeps everyone aligned, ensuring that developers, managers, and clients are looking at the same logic.
- Optimization: It is difficult to spot inefficiencies in a narrative description. When laid out visually, bottlenecks, loops, and redundant steps become immediately obvious.
- Precision: Complex systems require strict execution. A flowchart acts as the blueprint for execution, turning high-level plans into consistent actions.
Stepwise Refinement: Managing Complexity
One of the most powerful concepts in system modeling is Stepwise Refinement. This technique allows you to manage complexity without losing sight of the big picture. Instead of trying to model every single detail of a process at once, you start with a high-level overview (the “Big Picture”) and iteratively refine it into smaller, manageable sub-processes.
Imagine a flowchart for “Order Fulfillment.” At the top level, it might just have three steps: “Receive Order,” “Process Payment,” and “Ship Item.” This is clear and concise. However, “Process Payment” is complex. Using stepwise refinement, you create a new, detailed flowchart specifically for that sub-process, perhaps detailing credit card verification, fraud checks, and currency conversion. This keeps your main diagram clean while preserving the necessary detail where it is needed.
Visual Paradigm: The Architecture of Diagramming
Visual Paradigm (VP) is more than just a drawing tool; it is a comprehensive system architecture platform. It provides the structural integrity needed to maintain these models as they grow in complexity.
Standardized Notations
VP adheres to industry-standard notations (such as BPMN or UML Activity Diagrams). This ensures that when you create a diagram, it is not just a drawing, but a formal specification that can be understood by anyone trained in software engineering or business analysis.
The VPasCode Tool
For users who prefer a text-based approach or need to version-control their diagrams, the VPasCode tool is a game-changer. VPasCode allows you to define your flowchart logic using code rather than drag-and-drop operations. This is particularly useful for:
- Defining complex logic that is tedious to connect with a mouse.
- Integrating diagram creation into a software development workflow (CI/CD).
- Ensuring strict syntax compliance and formatting.
AI-Assisted Diagramming
Perhaps the most transformative feature in the modern era is the integration of AI (Artificial Intelligence). Traditional diagramming requires manual placement of shapes and lines. With Visual Paradigm’s AI capabilities, you can describe a process in natural language, and the system can generate the initial structure for you. This significantly reduces the time from “idea” to “diagram,” allowing you to focus on the logic rather than the geometry.
Constructing a Flowchart: A Step-by-Step Guide
Whether you are using the drag-and-drop interface or the VPasCode editor, the construction of a robust flowchart follows a logical sequence.
1. Define Start and End Points
Every process must have a clear origin and a destination. In a flowchart, these are typically represented by rounded rectangles or ovals. Never leave a process “floating”; ensure that every path eventually leads to an End node.
2. Map the Decision Logic
The core of any flowchart is the decision point. Represented by diamonds, these nodes determine the flow of control. A good rule of thumb is that a decision point should have at least one input and two or more outputs (typically labeled “Yes/No” or “True/False”).
3. Refine the Details
Once the high-level skeleton is in place, you refine the details. This involves adding specific actions, data inputs, and external entities. If a specific branch of the flowchart becomes too complex, apply the Stepwise Refinement technique and break it out into a sub-diagram.
Best Practices for Modern Modeling
To truly “Bring Order to Chaos,” adhere to these architectural principles when using your tools:
- Keep it Readable: Avoid crossing lines. If a diagram becomes a “spaghetti monster,” it has failed its primary purpose. Use layout tools to auto-arrange your shapes.
- Use Consistent Naming: Labels should be imperative verbs (e.g., “Calculate Tax,” “Verify User”) rather than nouns.
- Leverage AI for Syntax: When using VPasCode, let the AI check your syntax to ensure the generated diagram matches your intent perfectly.
Conclusion
Creating a flowchart is an exercise in clarity. By utilizing the power of Visual Paradigm, the precision of VPasCode, and the speed of AI, you can transform tangled processes into streamlined operations. Start mapping your processes today, and you will unlock the ability to execute with precision and drive better outcomes tomorrow.