


Strategic planning relies heavily on accurate industry assessment. For decades, Michael Porter’s Five Forces framework has stood as a cornerstone for understanding competitive landscapes. However, a common pitfall exists in how organizations apply this model. Many leaders treat the analysis as a static checklist rather than a dynamic diagnostic tool. This approach often leads to overgeneralization, where specific industry nuances are lost in broad strokes.
Overgeneralization can result in flawed strategies. It might lead a company to ignore emerging threats or underestimate the power of a niche competitor. To build robust strategies, one must dig deeper into the mechanics of each force. This guide explores how to conduct a precise analysis while avoiding the traps of generic thinking.
🧩 The Foundation of the Framework
Before addressing the pitfalls, it is essential to establish what the framework actually measures. The model evaluates the intensity of competition and the profitability of an industry. It looks beyond direct competitors to include factors that influence pricing and costs.
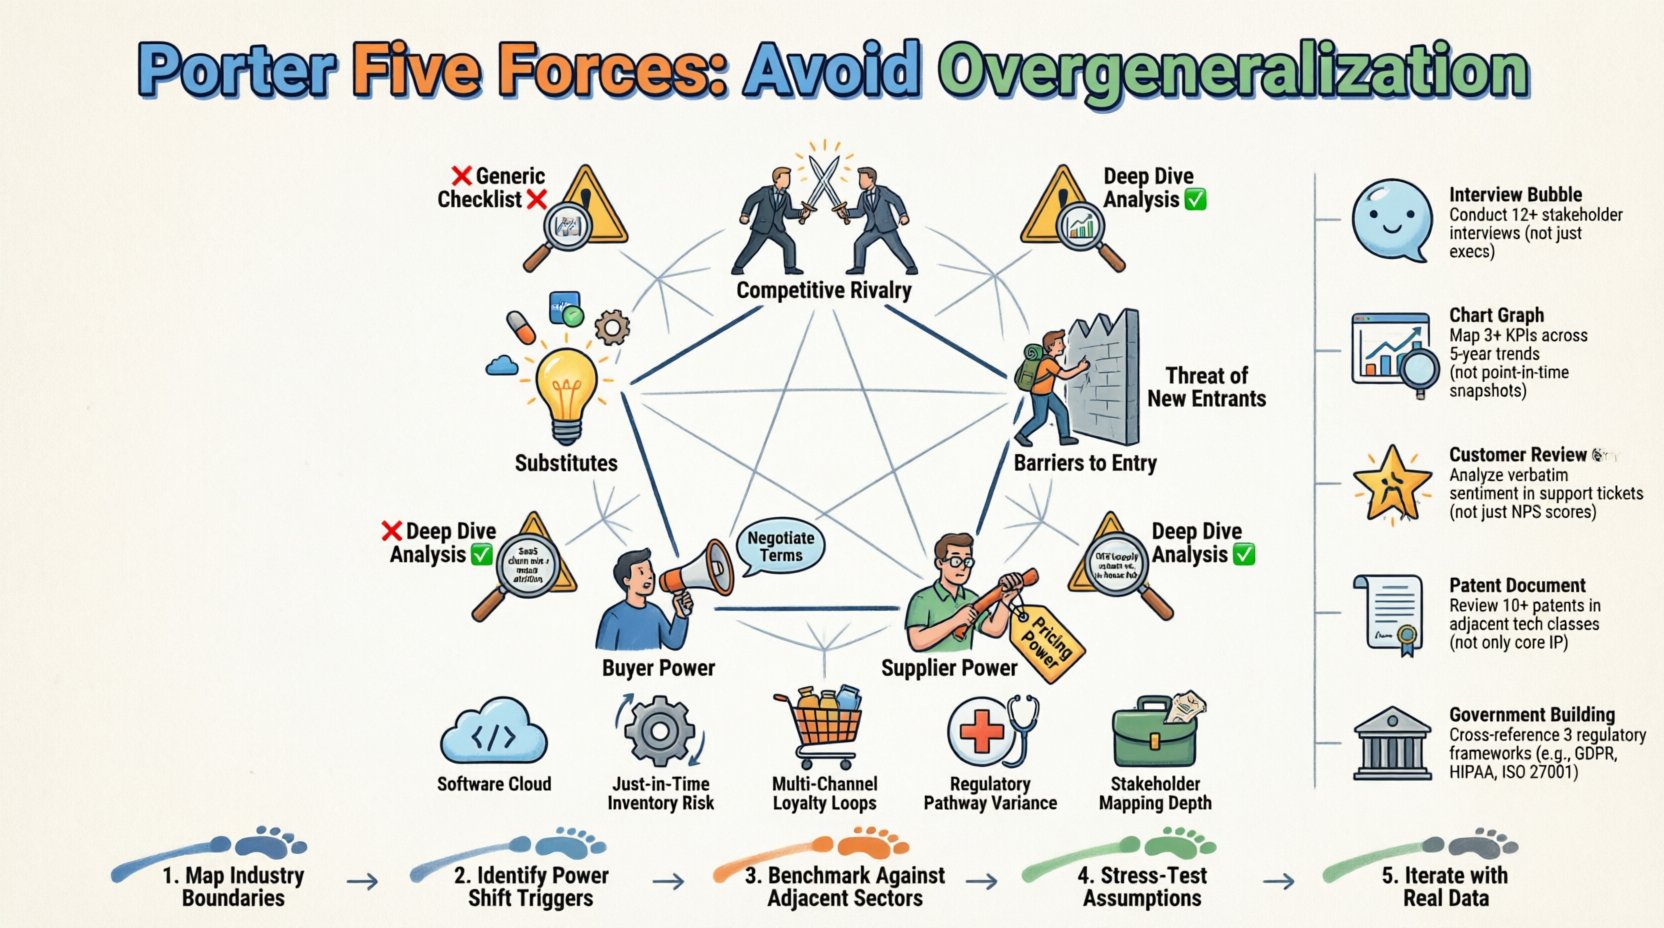
- Competitive Rivalry: The intensity of competition among existing firms.
- Threat of New Entrants: The likelihood of new competitors entering the market.
- Bargaining Power of Suppliers: The ability of suppliers to drive up prices.
- Bargaining Power of Buyers: The ability of customers to drive down prices.
- Threat of Substitutes: The availability of alternative products or services.
When applied correctly, this framework reveals the structural forces at play. When applied poorly, it becomes a generic exercise that yields little actionable insight.
⚠️ Why Overgeneralization Happens
Analysts often fall into the trap of assuming that all industries function similarly. This error stems from convenience. It is easier to apply a standard template than to investigate the unique mechanics of a specific sector. Here are the primary drivers of this issue:
- Data Availability: General data is easier to find than specific firm-level data.
- Cognitive Bias: Leaders often see what they expect to see based on past experiences.
- Time Constraints: Deep dives require significant time, which is often unavailable.
- Lack of Context: Ignoring regulatory or cultural differences that affect industry structure.
To counteract this, analysts must treat every industry as unique. A high barrier to entry in one sector might be negligible in another. The same applies to supplier power and buyer leverage. Context determines the weight of each force.
📉 Force 1: Threat of New Entrants
Many assessments state simply that barriers to entry are “high” or “low.” This binary view lacks utility. The reality is often a spectrum influenced by multiple variables.
Capital Requirements
It is tempting to assume that high capital investment always blocks entry. While true for manufacturing, the software industry often requires low capital but high intellectual investment. Do not rely solely on financial metrics.
Regulatory Hurdles
Some industries face strict licensing requirements. Others operate in gray areas. Overgeneralization occurs when an analyst assumes regulation is uniform across regions. A firm expanding globally must assess entry barriers in each jurisdiction separately.
Access to Distribution Channels
New entrants often struggle to get shelf space or digital visibility. However, in the digital age, distribution channels have democratized. A direct-to-consumer model can bypass traditional gatekeepers. Assess the specific channel dynamics of the target market, not the industry average.
⚖️ Force 2: Bargaining Power of Suppliers
Supplier power is often conflated with supplier count. A market with many suppliers does not automatically mean low power. The nature of the relationship matters more.
- Switching Costs: If changing suppliers requires retraining staff or retooling machinery, power shifts to the supplier.
- Uniqueness of Input: Proprietary technology can create a monopoly even with few competitors.
- Forward Integration: Can the supplier become a competitor? This threat adds leverage.
An overgeneralized analysis might count the number of suppliers and stop there. A precise assessment investigates the dependency ratio. If a single supplier provides 40% of a critical component, the count of other suppliers becomes secondary to the dependency risk.
💰 Force 3: Bargaining Power of Buyers
Buyer power is frequently misunderstood as simply “price sensitivity.” While cost is a factor, the ability to switch is the true driver of power.
Concentration of Buyers
If a small number of clients purchase the majority of a firm’s output, those clients hold leverage. This is common in B2B industries. Conversely, in B2C markets, individual buyers have little power unless they act collectively.
Price Sensitivity
Products that are undifferentiated lead to higher buyer power. If customers view the product as a commodity, they will chase the lowest price. Differentiation reduces this power, regardless of how many competitors exist.
Information Transparency
Modern technology allows buyers to compare prices instantly. This transparency has increased buyer power in many sectors. An assessment must account for the digital footprint of the industry. If price comparison is easy, buyer power is structurally higher.
🔄 Force 4: Threat of Substitutes
This force is often the most misunderstood. People confuse substitutes with competitors. A competitor offers the same product; a substitute offers a different solution to the same problem.
Functional Equivalence
Consider the transportation industry. A car competes with a bus, but a bicycle substitutes for short-distance driving. The substitute does not need to be similar in technology, only in function. Overgeneralization happens when analysts only look at direct product alternatives.
Price-Performance Trade-off
Substitutes often gain traction when they offer a better value proposition. If a substitute is cheaper or more convenient, it threatens the industry even if it is technologically inferior. Assess the total cost of ownership for the customer, not just the purchase price.
Switching Incentives
Why would a customer switch? If the current solution is deeply embedded in their workflow, switching costs are high. If the current solution is a simple tool, switching is easy. Evaluate the friction involved in adopting the substitute.
🥊 Force 5: Industry Rivalry
Competitive rivalry is the most visible force. However, assuming that “more competitors equals more rivalry” is a mistake. The structure of the competition matters more than the number of players.
Industry Growth Rate
In a shrinking market, firms fight for existing share, leading to intense price wars. In a growing market, firms can expand without directly attacking each other. Do not assume rivalry is high just because there are many players.
Differentiation Levels
When products are identical, rivalry centers on price. When products are distinct, rivalry centers on innovation and branding. Assess the degree of homogeneity in the market.
Fixed Costs
High fixed costs create pressure to utilize capacity. This often leads to aggressive pricing to cover overheads. Industries with high fixed costs tend to have more volatile rivalry.
📊 Industry Specific Nuances
Applying the framework requires adjusting the weight of each force based on the sector. The table below illustrates how the forces vary across different industries.
| Industry | High Impact Force | Key Nuance to Assess |
|---|---|---|
| Software & SaaS | Substitutes & Switching Costs | Network effects often create monopolies, making rivalry less intense but entry barriers high. |
| Heavy Manufacturing | Capital Requirements & Suppliers | High fixed costs mean capacity utilization drives pricing. Supplier relationships are critical. |
| Retail & E-commerce | Buyer Power & Rivalry | Low switching costs mean buyers have immense power. Price transparency drives competition. |
| Healthcare Services | Regulation & Suppliers | Regulatory barriers protect incumbents. Supplier power is high due to specialized medical inputs. |
| Consulting | Human Capital & Buyers | Employees are the primary asset. Buyer power is high because talent is the differentiator. |
This table highlights that a one-size-fits-all approach fails. Each sector requires a tailored view of the forces.
🔍 Methodology for Accurate Assessment
To avoid overgeneralization, the data gathering process must be rigorous. There are no shortcuts that guarantee accuracy, but specific practices improve reliability.
- Primary Research: Conduct interviews with industry insiders. Former employees and suppliers can reveal hidden dynamics.
- Financial Statement Analysis: Review margins and capital expenditure trends over time. Consistent margin compression indicates rising rivalry.
- Customer Feedback: Analyze complaints and reviews. Patterns in feedback often signal where buyer power is exerted.
- Patent Filings: Review patent data to understand innovation trends and the threat of technological substitution.
- Regulatory Filings: Examine government filings for licensing requirements and compliance costs.
Secondary data, such as industry reports, is useful but often lags reality. Primary research provides the current snapshot needed for strategic decisions.
🔄 Dynamic vs. Static Analysis
A common error is treating the analysis as a point-in-time snapshot. Industries evolve. The forces shift over time.
Technological Disruption
Technology can lower barriers to entry overnight. A service that took months to deliver can become automated. Assess the pace of technological change in the sector.
Globalization
Local markets are becoming global. A competitor from another continent may enter the market without warning. Assess the geographic scope of the competitive threat.
Regulatory Changes
Policy shifts can alter supplier power or buyer leverage instantly. New environmental laws might increase costs for suppliers, while new privacy laws might increase buyer power.
Strategies built on static analysis become obsolete quickly. Regular updates to the assessment are necessary to maintain relevance.
🧠 Integrating with Other Models
The Five Forces framework works best when combined with other analytical tools. It focuses on the industry, but strategy also depends on internal capabilities.
- SWOT Analysis: Use Five Forces to inform the “Threats” and “Opportunities” sections. Use internal data for “Strengths” and “Weaknesses”.
- PESTLE Analysis: Use PESTLE to understand the macro-environmental factors that drive the Five Forces.
- Value Chain Analysis: Identify where value is created in the industry to understand where margins exist.
Using these models together creates a holistic view. It prevents the tunnel vision that comes from focusing solely on competition.
🚫 Common Traps to Avoid
Even experienced strategists make mistakes. Here are specific traps to watch out for during the assessment process.
- Defining the Market Too Broadly: If you define the market as “Food,” the analysis becomes useless. Define it as “Premium Organic Coffee in Urban Centers”.
- Ignoring Complements: Products that enhance value are often overlooked. A printer needs ink. If ink prices rise, the printer market suffers.
- Focusing Only on Price: Non-price competition, such as brand loyalty and service quality, is often more significant.
- Assuming Rationality: Markets are not always rational. Emotional branding can override logical price comparisons.
- Neglecting the Supply Chain: Upstream disruptions can affect the entire industry structure. Do not look only at the end user.
📝 Actionable Steps for Implementation
Once the data is collected, the next step is synthesis. How do you turn insights into a plan?
- Score Each Force: Rate each force from Low to High based on the evidence gathered.
- Identify the Bottleneck: Determine which force is the primary constraint on profitability.
- Map Interactions: Analyze how one force affects another. High supplier power might reduce buyer power if suppliers absorb costs.
- Scenario Planning: Create scenarios for how the forces might change in the next 3 to 5 years.
- Strategic Alignment: Ensure the company’s resources are aligned to defend against the strongest forces.
🎯 Final Thoughts on Precision
Avoiding overgeneralization is not about complexity for complexity’s sake. It is about accuracy. Strategies built on accurate assessments of industry structure lead to sustainable competitive advantages. Generic analysis leads to generic results.
Invest time in understanding the specific mechanics of your sector. Respect the differences between industries. Use data to support claims, not assumptions. By treating the Five Forces as a living diagnostic tool rather than a static template, organizations can navigate uncertainty with greater confidence.
The goal is not to predict the future perfectly, but to understand the structural forces that will shape it. This understanding allows for proactive positioning rather than reactive scrambling. When the analysis is precise, the strategy becomes clear.

