The checkout process represents the final and most critical moment in the customer journey. It is where intent transforms into revenue. However, many organizations treat checkout as a static technical endpoint rather than a dynamic behavioral experience. When friction occurs here, the investment made in acquisition, engagement, and consideration evaporates. To address this, we must shift from guessing to knowing. By leveraging journey data insights, we can identify exactly where users hesitate, where they drop off, and why they abandon their carts. This guide outlines a methodical approach to analyzing and optimizing these flows without relying on marketing hype or unverified assumptions.
Understanding the Checkout Ecosystem 🌐
A checkout flow is not merely a form to be filled. It is a complex sequence of interactions that encompasses navigation, data entry, validation, payment processing, and confirmation. Each step introduces potential points of failure. Data collected throughout the entire customer journey provides context that isolated metrics often miss. For instance, a user might abandon a cart not because of shipping costs, but because they encountered a confusing navigation path prior to reaching the payment page.
To optimize effectively, we must view the checkout as an extension of the broader shopping experience. This requires a holistic view of the data. We are looking at the path the user took to get to the cart, the time spent on product pages, the devices used, and the specific interactions within the checkout interface itself. This depth of information allows for precise interventions rather than broad, often ineffective, changes.
Key Components of the Flow
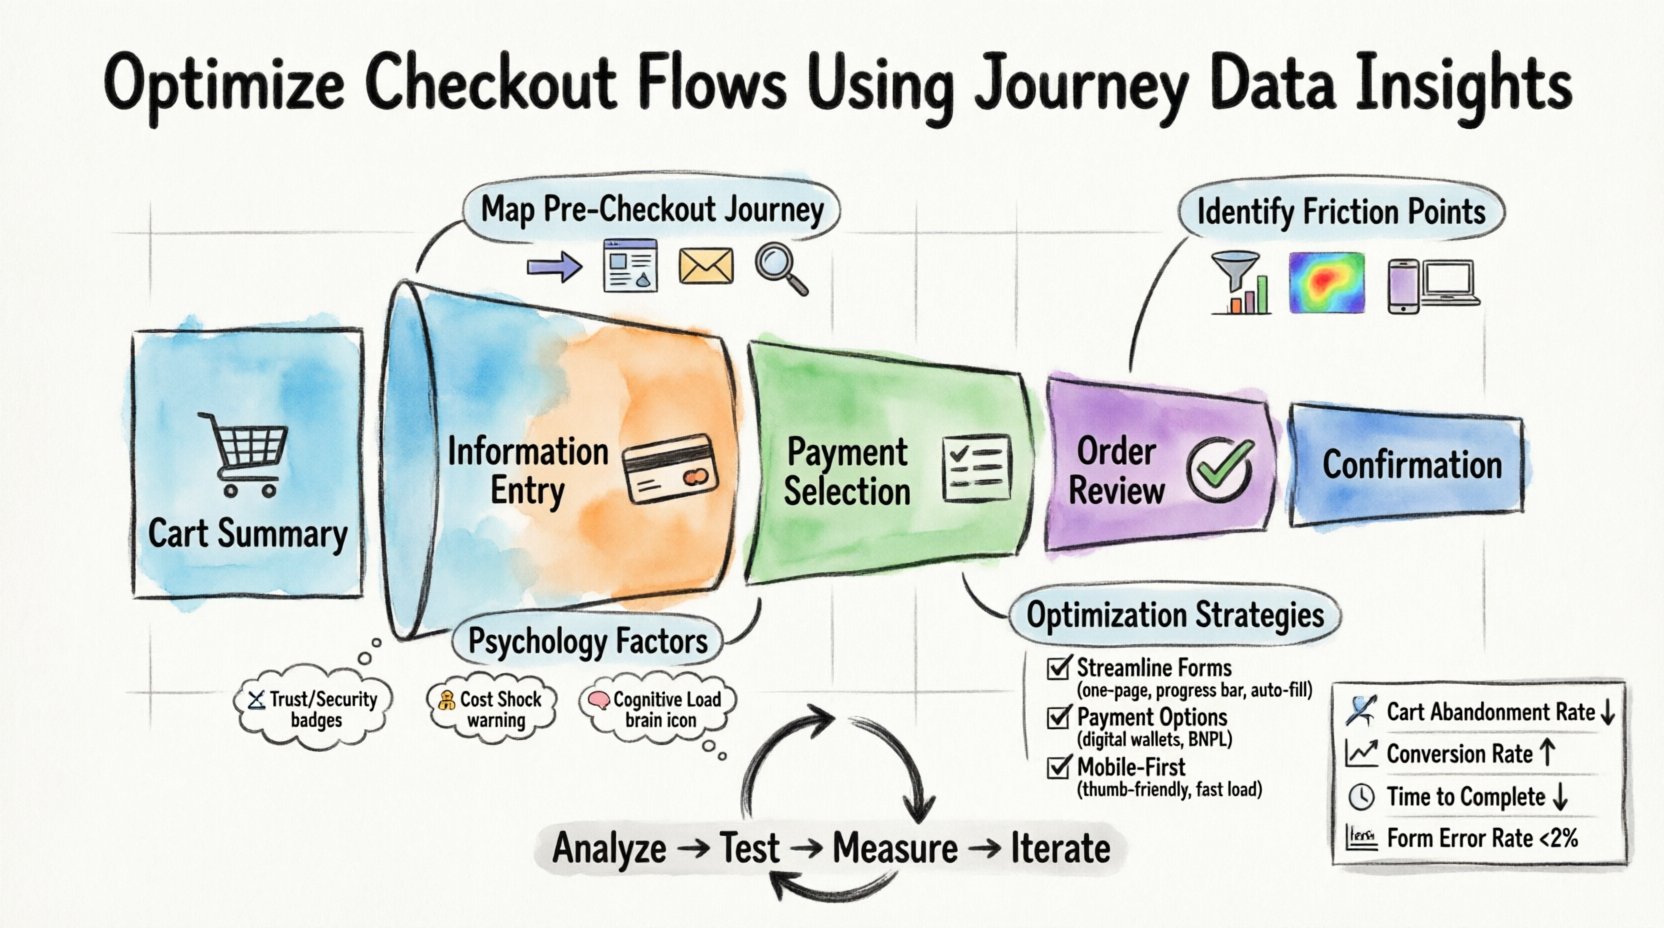
- Cart Summary: The review stage where users verify items and costs.
- Information Entry: Billing, shipping, and contact details.
- Payment Selection: Choosing the method of transaction.
- Order Review: The final confirmation before submission.
- Confirmation: The success state and post-purchase guidance.
Each component can be analyzed for efficiency and clarity. Data insights reveal which components cause the most hesitation. For example, if data shows a high drop-off rate at the “Billing Address” stage, it may indicate that the form fields are too granular or confusing for the user base.
Mapping the Pre-Checkout Journey 🗺️
Optimization begins before the user ever sees the checkout page. The journey leading up to the cart is equally critical. If the path is obstructed, the user may arrive at the checkout with hesitation or uncertainty. Mapping this journey allows us to see the full picture.
Identifying Entry Points
Users enter the checkout process from various sources. Some come directly from a product page, while others return from a saved cart or a promotional link. Journey data helps categorize these entry points.
- Direct Navigation: Users who have purchased before or bookmarked the cart.
- Product Page: Users who added an item and clicked checkout immediately.
- Marketing Channels: Users arriving via email or social media campaigns.
- Search: Users who searched for specific terms and found the product.
Understanding the source helps tailor the experience. A returning user might appreciate a saved address, while a new user might need more trust signals. Journey data tracks these behaviors to inform personalization strategies.
Session Duration and Engagement
The amount of time a user spends on the site before reaching checkout is a significant indicator of engagement. However, excessive time spent can also signal confusion. We must analyze the distribution of time.
- Short Duration: Indicates high intent or prior knowledge of the product.
- Long Duration: May suggest difficulty comparing options, reading reviews, or navigating the site.
- Revisits: Users who leave the cart and return later often need different incentives or reminders.
Identifying Friction Points in Data 🔍
Friction is the resistance a user feels during the process. It manifests as delays, errors, or cognitive load. Journey data helps pinpoint exactly where this resistance occurs. We look for patterns that deviate from the norm.
Funnel Analysis
A funnel analysis breaks down the checkout process into stages and calculates the conversion rate between them. This is the most fundamental way to identify drop-off points.
- Cart to Initiate Checkout: High drop-off here suggests the cart summary is unclear or shipping costs are too high.
- Initiate to Information Entry: Users starting but not filling fields may be intimidated by the length of the form.
- Information Entry to Payment: A drop here often points to validation errors or unexpected fees revealed late.
- Payment to Confirmation: This is the final barrier. Issues here relate to payment gateway errors or security concerns.
Behavioral Heatmaps and Recordings
While not all data is numerical, visual data is powerful. Session recordings allow us to watch how users interact with the interface. Heatmaps show where they click and how far they scroll.
- Click Density: Are users clicking on elements that do not lead anywhere?
- Scroll Depth: Do they see the trust badges and guarantees below the fold?
- Rage Clicking: Repeated clicking on non-interactive elements indicates confusion or a broken link.
Device and Platform Segmentation
Behavior varies significantly between desktop and mobile. A checkout flow optimized for a desktop screen may be unusable on a smartphone.
- Touch Targets: Buttons must be large enough for fingers on mobile devices.
- Input Methods: Keyboard types should adapt to the field (e.g., numeric pad for phone numbers).
- Network Latency: Mobile users on slower connections may experience timeouts during payment processing.
The Psychology of Checkout Abandonment 🧠
Numbers tell us what is happening; psychology explains why. Understanding the mental state of a user at checkout helps us design flows that reduce anxiety and build confidence. Data insights can highlight psychological barriers.
Trust and Security
Users must feel safe entering financial information. Journey data shows where users look for security indicators. If they hesitate at the payment step, it is often because they do not see the necessary trust signals.
- Visual Cues: Lock icons, SSL badges, and recognizable payment logos.
- Transparency: Clear display of total costs before the final click.
- Privacy Assurance: Statements about data protection can reduce hesitation.
Cost Shock
One of the most common reasons for abandonment is unexpected costs revealed late in the process. If shipping, taxes, or fees are not shown until the payment stage, users feel a loss of control.
- Early Disclosure: Show estimated costs on the product or cart page.
- Progress Indicators: Allow users to see how close they are to the final total.
- Free Shipping Thresholds: Encourage users to add more items to reach a goal.
Cognitive Load
Too many choices or complex forms overwhelm the brain. This is known as decision fatigue. Data can show which form fields cause the most errors or delays.
- Field Simplification: Remove non-essential fields.
- Auto-Fill: Use browser capabilities or address lookup tools to reduce typing.
- Guest Checkout: Do not force account creation as a prerequisite for purchase.
Strategies for Optimization Based on Insights 🛠️
Once data reveals the friction points, specific strategies can be implemented. These should be tested and measured to ensure they improve the metrics.
Streamlining Forms
Forms are the primary source of friction. Analyzing error rates on specific fields helps determine what needs changing.
- One-Page Checkout: Consolidate all steps onto a single screen to reduce page loads.
- Progress Bars: Show users how many steps remain to completion.
- Input Validation: Provide immediate feedback on errors rather than waiting for form submission.
- Address Autocomplete: Integrate services that suggest addresses based on partial input.
Enhancing Payment Options
Different users prefer different payment methods. Restricting options can cause drop-offs. Data on payment method selection helps prioritize which options to offer.
- Digital Wallets: Support Apple Pay, Google Pay, or PayPal for faster checkout.
- Buy Now, Pay Later: Offer financing options for higher-ticket items.
- Regional Methods: Include local payment methods for international customers.
Mobile Optimization
With a significant portion of traffic coming from mobile, a mobile-first approach is essential.
- Responsive Design: Ensure the layout adapts to all screen sizes.
- Thumb-Friendly Navigation: Place key actions within easy reach of the thumb.
- Speed Optimization: Compress images and minimize scripts to ensure fast load times.
Common Friction Points and Data Indicators
| Friction Point | Data Indicator | Potential Solution |
|---|---|---|
| Unexpected Shipping Costs | High drop-off at “Review Order” step | Display shipping costs on cart page |
| Account Creation Forced | High abandonment after “Sign In” click | Enable Guest Checkout option |
| Form Validation Errors | High retry rate on specific fields | Implement real-time validation |
| Payment Decline | Transaction failure logs | Offer alternative payment methods |
| Slow Page Load | High exit rate during loading | Optimize server response time |
Measuring Success and Iterating 📈
Optimization is not a one-time event. It is a continuous cycle of analysis, implementation, and measurement. We must establish clear Key Performance Indicators (KPIs) to track progress.
Key Metrics to Track
| Metric | Definition | Target Goal |
|---|---|---|
| Cart Abandonment Rate | Percentage of carts created but not purchased | Reduce by 10% quarter-over-quarter |
| Checkout Conversion Rate | Percentage of initiated checkouts that result in a sale | Increase by 5% per month |
| Time to Complete Checkout | Average time from cart to confirmation | Reduce by 20 seconds |
| Form Error Rate | Percentage of form submissions requiring correction | Keep below 2% |
| Revenue Per Visitor | Total revenue divided by total visitors | Steady growth trend |
Testing Methodology
Changes should never be made without testing. A/B testing allows us to compare two versions of a page to see which performs better.
- Control Group: The current version of the checkout flow.
- Test Group: The modified version with a specific change.
- Statistical Significance: Ensure the sample size is large enough to validate results.
- Long-Term Monitoring: Watch for seasonal trends that might skew data.
Qualitative Feedback
Quantitative data tells us what is happening, but qualitative data tells us why. Surveys and user interviews add context to the numbers.
- Exit Surveys: Ask users why they left the cart before they go.
- User Testing: Observe users performing tasks in a controlled environment.
- Support Tickets: Analyze customer service inquiries related to checkout issues.
Long-Term Data Strategy 🔄
Sustainable optimization requires a long-term strategy. It involves building a culture where data drives decision-making at every level. This means moving away from intuition and towards evidence.
Data Governance
Ensure that the data collected is accurate and reliable. Inconsistent data leads to incorrect conclusions.
- Standardization: Define consistent naming conventions for events and metrics.
- Integration: Ensure data from different systems (e.g., CRM, Analytics, Payment Gateway) aligns.
- Privacy: Adhere to data protection regulations and respect user privacy.
Continuous Learning
The digital landscape changes rapidly. What works today may not work tomorrow. Staying informed about industry trends and new technologies is crucial.
- Industry Benchmarks: Compare your metrics against industry standards.
- Emerging Technologies: Explore AI-driven personalization or voice commerce.
- Competitor Analysis: Observe how competitors handle their checkout flows.
Final Thoughts on Optimization 🎯
Optimizing checkout flows using journey data insights is a disciplined process. It requires patience, precision, and a commitment to understanding the user. By mapping the journey, identifying friction, and testing solutions, we can create a seamless experience that converts. The goal is not just to sell more, but to build trust and loyalty. When users feel confident and respected during the transaction, they are more likely to return. This cycle of improvement ensures the business remains competitive and responsive to customer needs.
The path forward involves constant vigilance. Metrics will fluctuate, and user behavior will evolve. The key is to remain adaptable and rely on the data to guide the way. By focusing on the user experience and removing barriers, we create a checkout flow that supports both the customer and the business. This is the essence of effective optimization.

