Building a customer journey map without accurate data is like navigating a city with a map from ten years ago. The streets may look similar, but the landmarks have changed, new roads have opened, and traffic patterns are entirely different. For organizations aiming to deliver exceptional experiences, the foundation of any journey map is robust, validated user data. This guide explores the proven methods for gathering user data for journey mapping, ensuring your maps reflect reality rather than assumptions.
Understanding how customers interact with your brand across various touchpoints requires a mix of qualitative and quantitative insights. This comprehensive approach allows you to identify pain points, emotional highs and lows, and critical moments of truth. By systematically collecting and analyzing information, teams can construct maps that drive meaningful business decisions and improve overall customer satisfaction.
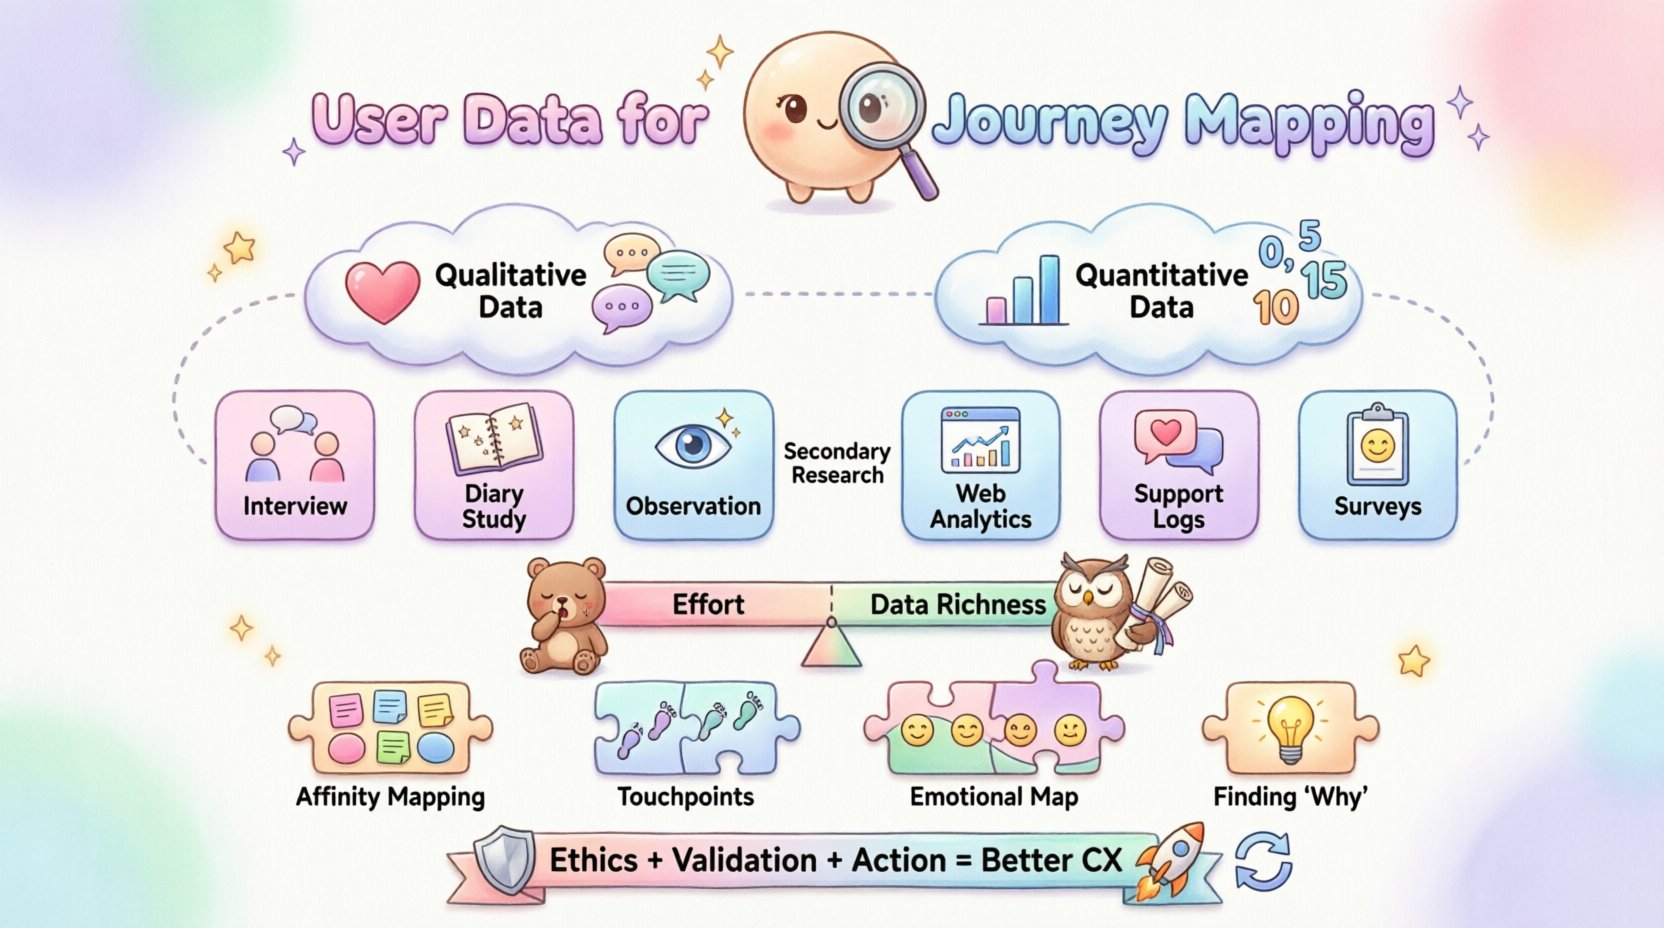
🔍 The Foundation: Understanding Data Types
Before selecting specific research methods, it is essential to understand the two primary categories of data used in journey mapping. Each type serves a distinct purpose and offers different levels of insight into the user experience.
Qualitative Data
Qualitative data provides depth and context. It answers the “why” behind user behaviors. This type of information often comes from direct interactions with users and helps explain the motivations, feelings, and thought processes driving their actions. When gathering user data for journey mapping, qualitative insights are crucial for:
- Identifying emotional triggers during specific stages.
- Understanding the language users employ to describe their problems.
- Uncovering hidden frustrations that metrics might miss.
- Defining the narrative flow of the journey.
Common sources include interviews, observations, and open-ended survey responses. This data is subjective but rich in detail, allowing you to build personas and empathy maps that resonate with the human experience.
Quantitative Data
Quantitative data provides breadth and scale. It answers the “what,” “where,” and “how much.” This information is numerical and objective, often derived from analytics tools, transaction logs, or structured surveys. It helps validate whether the patterns observed in qualitative research are widespread across the entire user base. Key applications include:
- Measuring conversion rates at specific touchpoints.
- Tracking time spent on different pages or stages.
- Identifying drop-off points in the funnel.
- Validating the frequency of specific behaviors.
Combining both data types creates a holistic view. Qualitative data tells the story, while quantitative data confirms the volume and significance of that story.
🗣️ Primary Research Methods: Direct Engagement
Primary research involves collecting data directly from users. This is often the most valuable source for journey mapping because it captures the user’s voice without filtering through business assumptions.
1. In-Depth User Interviews
One-on-one interviews allow researchers to dive deep into a participant’s history with a product or service. The goal is to reconstruct the timeline of their experience from the moment they first became aware of a need until the current point of interaction.
Effective interview techniques include:
- Scenario-Based Questions: Ask users to walk you through a specific task they completed recently.
- Emotional Check-Ins: Prompt them to describe how they felt at each step of the process.
- Contextual Inquiry: Ask about the environment in which they are using the service (e.g., distracted, focused, mobile).
Recording these sessions and transcribing them allows for detailed analysis of sentiment and specific friction points. This method is particularly effective for mapping the early stages of a journey, such as awareness and consideration.
2. Diary Studies
Diary studies ask participants to log their experiences over a period of time. This method captures real-time data, reducing the risk of recall bias where users might forget details about a past experience.
Participants might be asked to:
- Take photos of interactions with a product.
- Write short entries about their feelings after specific tasks.
- Log the time and context of each interaction.
This longitudinal approach is excellent for mapping complex journeys that span days or weeks, such as purchasing a home or planning a major event.
3. Contextual Observation
Observing users in their natural environment provides insights that they might not articulate in an interview. Researchers watch how users interact with a product or service without intervening.
Key focus areas include:
- Physical barriers (e.g., poor lighting, noise).
- Workarounds users create when processes fail.
- Non-verbal cues of frustration or delight.
This method is highly effective for physical retail experiences or hybrid digital-physical services.
📊 Secondary Research Methods: Digital Traces & Feedback
Secondary research leverages data that already exists within the organization. While this data may lack the narrative depth of primary research, it offers scale and behavioral evidence.
1. Web Analytics
Tools that track user behavior on websites and applications provide a clear picture of the digital path. By analyzing flow reports, heatmaps, and session recordings, teams can visualize the actual routes users take.
Key metrics to examine include:
- Bounce Rates: High bounce rates on specific pages may indicate a mismatch between expectation and content.
- Exit Pages: Identifying where users leave the site reveals potential friction points.
- Time on Page: Low time spent might suggest confusion or lack of engagement.
2. Customer Support Logs
Support tickets and chat logs are a goldmine for identifying pain points. They contain direct feedback from users who encountered issues and sought help.
To utilize this data effectively:
- Tag tickets by journey stage (e.g., Onboarding, Billing, Renewal).
- Look for recurring themes in complaints.
- Categorize issues by severity and frequency.
These logs often reveal the “dark side” of the journey where the process breaks down.
3. Survey Data
Surveys can be distributed to a large audience to gather structured feedback. While they lack the depth of interviews, they provide statistical significance.
Common survey types include:
- NPS (Net Promoter Score): Measures overall loyalty and satisfaction.
- CSAT (Customer Satisfaction): Measures satisfaction with a specific interaction.
- CES (Customer Effort Score): Measures how easy it was for a user to complete a task.
📋 Comparison of Data Gathering Methods
Choosing the right method depends on your resources, timeline, and the specific stage of the journey you are mapping. The table below outlines the characteristics of each approach.
| Method | Best For | Effort Level | Data Richness | Sample Size |
|---|---|---|---|---|
| In-Depth Interviews | Emotional drivers, motivations | High | Very High | Small (5-10) |
| Diary Studies | Long-term journeys, habits | Medium | High | Medium (10-20) |
| Web Analytics | Digital behavior, drop-off points | Low | Medium | Large (1000+) |
| Support Logs | Problem identification, friction | Low | Medium | Large (All tickets) |
| Surveys | Validation, broad sentiment | Medium | Low | Large (100+) |
| Observation | Physical context, non-verbal cues | High | Very High | Small (5-15) |
🧩 Synthesis: Turning Data into Maps
Collecting data is only the first step. The synthesis phase involves organizing this information into a coherent narrative. This process transforms raw data points into actionable journey stages.
1. Affinity Mapping
Start by placing all qualitative data points (quotes, observations, notes) onto a board or digital space. Group similar ideas together. This visual clustering helps identify common themes, such as “confusion during checkout” or “ease of finding information.” These clusters become the backbone of your journey stages.
2. Touchpoint Identification
List every interaction a user has with your brand. This includes website visits, emails, phone calls, in-store visits, and social media interactions. Cross-reference this list with your analytics data to see which touchpoints are most frequently used and which are critical for conversion.
3. Emotional Mapping
Plot the user’s emotional state against the journey stages. Use a line graph where the x-axis represents the journey stages and the y-axis represents sentiment (positive to negative). This visual representation highlights moments of delight and moments of frustration.
4. Identifying the “Why”
For every dip in the emotional graph, ask “why?” Use the qualitative data to explain the dip. Is the user confused? Are they frustrated by a slow loading time? Is the pricing unclear? This step connects the data to the specific cause of the friction.
🛡️ Ensuring Accuracy and Bias Control
When gathering user data for journey mapping, it is vital to guard against biases that can skew the results.
- Confirmation Bias: Avoid selecting data that only supports your existing hypotheses. Actively look for data that contradicts your assumptions.
- Selection Bias: Ensure your participants represent the full spectrum of users, not just the most vocal or satisfied ones. Include users who churned or dropped off.
- Social Desirability Bias: In interviews, users may tell you what they think you want to hear. Create a safe environment and ask indirect questions to mitigate this.
- Recall Bias: Users may not remember details accurately. Use diary studies or analytics to verify self-reported behaviors.
🌍 Ethical Considerations in Data Collection
Respecting user privacy is paramount when collecting personal information. Transparency builds trust and ensures compliance with regulations.
- Consent: Always obtain explicit permission before recording interviews or tracking user behavior.
- Anonymity: Remove personally identifiable information (PII) from your journey maps and internal reports.
- Data Security: Store collected data securely and limit access to authorized team members only.
- Usage Policy: Clearly communicate how the data will be used and assure users it will not be shared with third parties.
🔄 Continuous Validation
A journey map is not a static document. It is a living artifact that should evolve as the product and the market change. Regularly validate your map against new data.
- Quarterly Reviews: Check if new features have altered the journey flow.
- Post-Change Testing: After making a significant update, re-run key user interviews to see if the pain points have resolved.
- Feedback Loops: Create a system where customer support and sales teams regularly feed insights back into the journey mapping team.
🚀 Best Practices for Implementation
To successfully implement these methods, consider the following operational guidelines.
- Multidisciplinary Teams: Include members from product, design, marketing, and support. Different departments see different parts of the journey.
- Visual Collaboration: Use physical or digital whiteboards where teams can collectively analyze data and build the map together.
- Focus on Moments of Truth: Prioritize the critical moments that define the relationship between the user and the brand.
- Keep it Simple: Avoid over-complicating the map. Focus on the primary path most users take, rather than every possible edge case.
- Actionable Insights: Ensure every section of the map suggests a potential improvement or action item.
📈 Measuring Impact
Once the journey map is built and actions are taken, measure the impact. Did the friction points decrease? Did conversion rates improve? Did customer satisfaction scores rise?
Tracking these metrics validates the value of the journey mapping process. It shifts the conversation from “we made a map” to “we improved the experience based on data.” This cycle of gather, map, act, and measure ensures continuous improvement in customer experience.
🔗 Integrating with Broader Strategy
Journey mapping should not exist in a vacuum. Integrate the insights into broader business strategies.
- Product Roadmaps: Use journey pain points to prioritize feature development.
- Marketing Content: Align messaging with the language and concerns found in user interviews.
- Service Design: Use the map to train customer service agents on the end-to-end context of a user’s request.
- Internal Alignment: Share the map with all departments to ensure everyone understands the customer perspective.
📝 Final Considerations
Gathering user data for journey mapping is a discipline that blends art and science. It requires the empathy of a qualitative researcher and the rigor of a data analyst. By employing a mix of primary and secondary methods, maintaining ethical standards, and continuously validating findings, organizations can create journey maps that are accurate, actionable, and valuable.
Remember that the goal is not just to document the journey, but to improve it. Every piece of data collected should serve the purpose of understanding the human behind the transaction. When done correctly, these maps become the blueprint for building products and services that truly resonate with user needs and expectations.
Start small, iterate often, and keep the user at the center of every decision. This approach ensures that your journey maps remain relevant tools for growth rather than static artifacts gathering dust on a shelf.

