In the modern business landscape, understanding the customer experience is not just an advantage; it is a necessity. A customer journey map provides a visual representation of the entire process a customer goes through when interacting with your brand. This tool helps organizations identify pain points, uncover opportunities for improvement, and align internal teams around a shared vision of the customer experience.
Building an effective map requires careful planning, data-driven insights, and a commitment to empathy. This guide details the process of creating a comprehensive map without relying on specific software solutions, focusing instead on the fundamental principles of mapping.
📋 Why Build a Customer Journey Map?
Before diving into the creation process, it is essential to understand the value proposition. A well-executed map serves several critical functions:
- Empathy: It shifts the perspective from internal processes to external user experiences.
- Alignment: It brings together marketing, sales, support, and product teams on the same page.
- Identification: It highlights friction points where customers drop off or become frustrated.
- Strategy: It informs decision-making regarding resource allocation and process changes.
Without this visibility, teams often optimize in silos, leading to disjointed experiences. The map acts as a single source of truth for how a customer perceives the brand across time.
🛠️ Preparation: Gathering the Right Inputs
Success begins before you draw the first line. Preparation involves collecting qualitative and quantitative data. Relying on assumptions can lead to inaccurate maps that do not reflect reality.
1. Define the Scope
A journey map can cover a single interaction or the entire lifecycle. For maximum impact, start with a specific persona and a specific goal. For example, rather than mapping “all customers,” focus on “New Enterprise Clients seeking onboarding support.” This specificity ensures the insights are actionable.
2. Identify Stakeholders
Mapping is a collaborative effort. You need input from various departments to capture the full picture.
- Customer Support: They know the common complaints and questions.
- Sales Team: They understand the buying process and objections.
- Product Managers: They know feature usage and adoption barriers.
- Marketing: They understand how customers first learn about the brand.
3. Collect Data
Data provides the backbone for your map. Use a mix of sources to ensure robustness.
- Interviews: Conduct one-on-one sessions with customers to hear their stories.
- Surveys: Gather broad feedback on satisfaction and specific interactions.
- Analytics: Look at behavioral data to see where users click, drop off, or linger.
- Support Logs: Analyze ticket history for recurring issues.
🚀 Step-by-Step Creation Process
Once the data is gathered, you can begin constructing the map. Follow these sequential steps to ensure a logical flow.
Step 1: Define the Persona
Every journey belongs to a person. You cannot map a “customer” in the abstract; you must map a specific archetype. Create a detailed profile that includes:
- Demographics (Age, Location, Role)
- Goals and Motivations
- Challenges and Pain Points
- Technical Proficiency
Give this persona a name and a photo. This humanizes the data and keeps the team focused on a real person.
Step 2: Outline the Stages
Divide the journey into distinct phases. These represent the chronological progression of the relationship. Common stages include:
- Awareness: The customer realizes they have a problem.
- Consideration: The customer evaluates potential solutions.
- Purchase: The transaction occurs.
- Retention: The customer continues to use the product.
- Advocacy: The customer recommends the brand to others.
Ensure the stages align with the persona’s goals. If the persona is looking for a quick fix, the “Consideration” phase may be very short.
Step 3: Map the Touchpoints
A touchpoint is any interaction a customer has with the brand. List every channel used during each stage.
- Website landing pages
- Social media interactions
- Email communications
- Phone calls with sales
- Product installation or setup
- Customer service tickets
Identify where these interactions happen. Is the customer on mobile or desktop? Are they in a physical store or online? Context matters significantly for the experience.
Step 4: Chart the Emotions
Customers are not rational actors. Their feelings drive their behavior. Plot the emotional state of the persona at each stage. This is often represented as a curve.
- High Points: Moments of delight or satisfaction.
- Low Points: Moments of frustration, confusion, or anger.
Look for patterns. If the emotion consistently drops during the “Setup” phase, that is a critical area for improvement. This emotional layer transforms the map from a process flow into an experience analysis.
Step 5: Identify Pain Points and Opportunities
Analyze the data to find where things go wrong and where they can go right.
- Pain Points: Barriers that prevent the customer from achieving their goal. Examples include slow load times, confusing navigation, or lack of support availability.
- Opportunities: Areas where you can enhance the experience. Examples include proactive support, personalized recommendations, or faster onboarding.
📊 Structuring the Information
To make the map readable, organize the data into a clear structure. A table is often the most effective way to present this information initially before moving to a visual diagram.
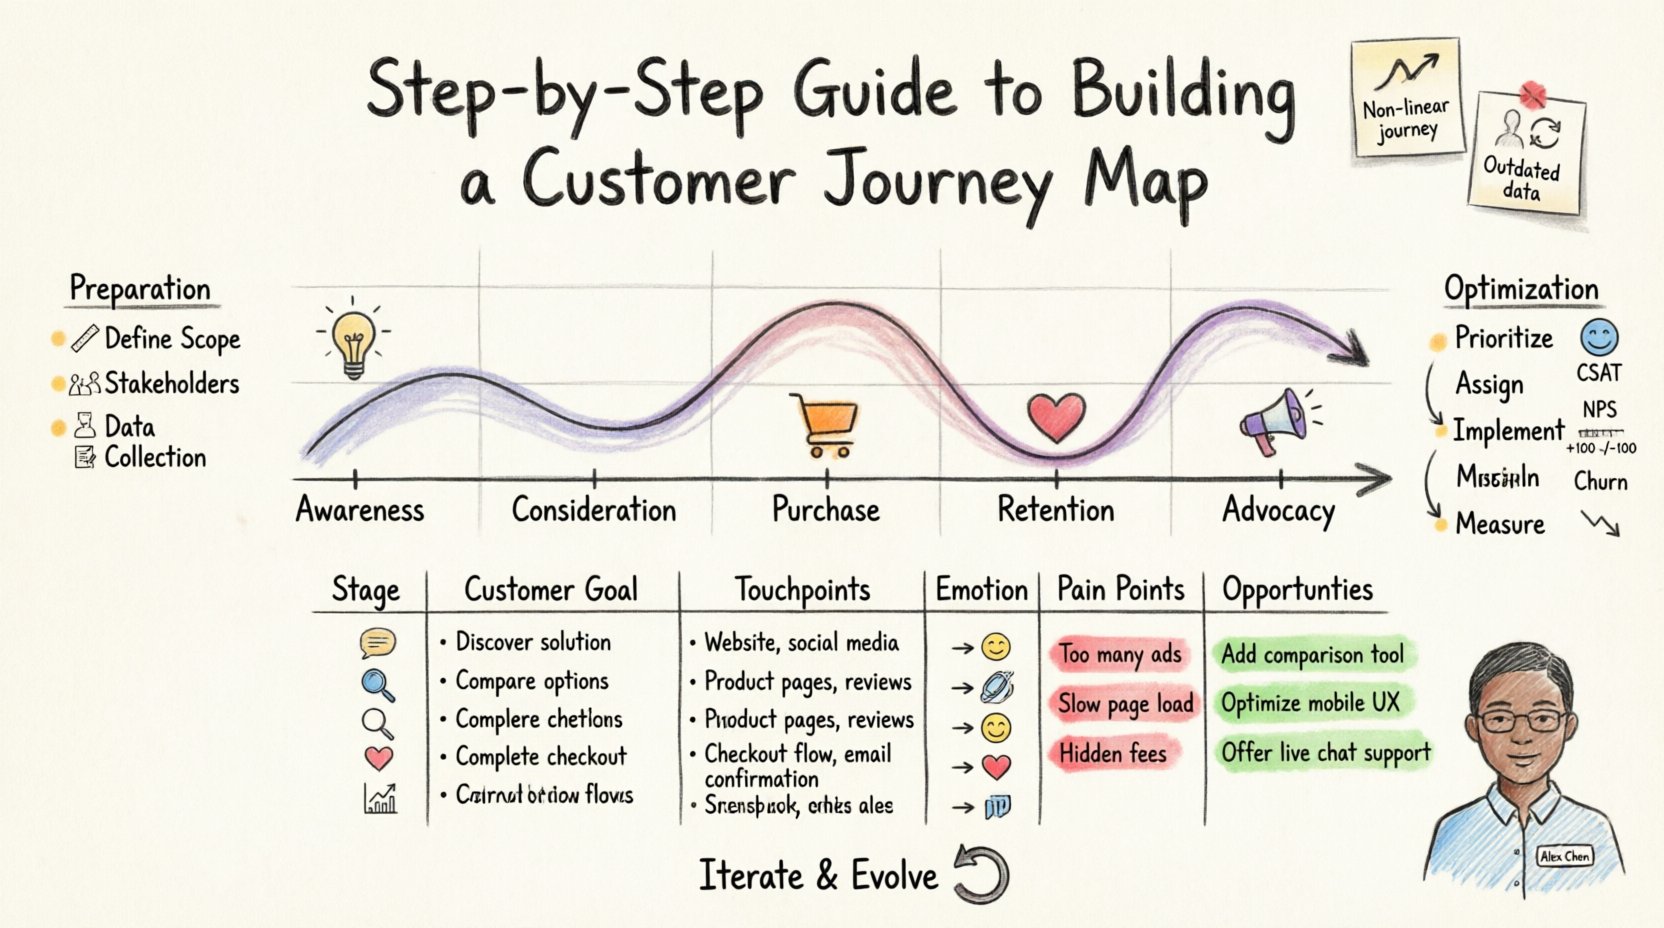
| Stage | Customer Goal | Touchpoints | Emotion | Pain Points | Opportunities |
|---|---|---|---|---|---|
| Awareness | Identify problem | Social Ads, Search | Curious | Ads are irrelevant | Targeted content |
| Consideration | Evaluate solutions | Website, Demo | Hesitant | Complex pricing | Clear comparisons |
| Purchase | Complete transaction | Checkout Page | Relieved | Hidden fees | Transparent billing |
| Retention | Use product | Support Chat, Docs | Confused | Slow response | Proactive help |
This structured approach ensures that every element of the journey is accounted for and analyzed.
🎨 Visualizing the Map
Once the data is structured, it needs to be visualized. While digital tools exist, the principles of visualization remain the same regardless of the medium.
1. Choose a Layout
Most maps follow a horizontal timeline. The stages run from left to right, representing the flow of time. This allows viewers to see the progression easily.
2. Use Color Coding
Colors can communicate status and sentiment quickly.
- Green: Positive experiences or successful actions.
- Red: Critical pain points or failures.
- Yellow: Neutral areas or areas for monitoring.
3. Layer the Data
Do not clutter the map. If you have too much information, consider creating multiple layers or separate maps for different personas. A single map should tell one clear story.
🔄 Analysis and Optimization
Creating the map is only half the work. The real value comes from acting on the insights. This phase involves translating the visual data into business strategy.
1. Prioritize Issues
You cannot fix everything at once. Use a prioritization framework to decide what to address first. Consider the impact of the issue on the customer and the effort required to fix it.
- High Impact, Low Effort: Fix these immediately.
- High Impact, High Effort: Plan these for major initiatives.
- Low Impact, Low Effort: Handle as maintenance.
- Low Impact, High Effort: Consider deferring.
2. Assign Ownership
Every improvement action must have an owner. If no one is responsible, the map will sit on a shelf. Assign tasks to specific departments or individuals.
- Product Team: Responsible for feature usability.
- Marketing Team: Responsible for messaging clarity.
- Support Team: Responsible for response times.
3. Implement Changes
Execute the plan. This might involve updating website copy, changing a process, or training staff. Communication is key. Ensure all teams understand why the change is happening based on the map data.
📉 Measuring Success
How do you know if the map and the subsequent changes worked? You need to measure the impact using key performance indicators (KPIs).
- Customer Satisfaction Score (CSAT): Measures satisfaction at specific touchpoints.
- Net Promoter Score (NPS): Measures overall loyalty and likelihood to recommend.
- Churn Rate: Tracks how many customers stop using the service.
- Conversion Rate: Tracks how many customers move from one stage to the next.
- Time to Value: Measures how long it takes for a customer to get value from the product.
Review these metrics regularly. If a metric improves after a change, the map was accurate. If it does not, you may need to revisit your assumptions.
⚠️ Common Pitfalls to Avoid
Even experienced teams make mistakes when mapping. Being aware of these common errors can save time and resources.
1. Assuming the Process is Linear
Customers do not always move in a straight line. They may loop back, skip stages, or interact simultaneously. Allow for non-linear paths in your analysis.
2. Ignoring Internal Processes
A journey map is not just about the front end. It often reveals backend issues. For example, a customer might call support because a system notification failed. You must look behind the curtain to see what is happening internally.
3. Relying on One Persona
One map rarely fits all. A business might have different segments with vastly different needs. Consider creating a “Day in the Life” map for different personas to see where the experiences diverge.
4. Creating It Once and Forgetting
The customer journey is not static. Markets change, products evolve, and customer expectations shift. Treat the map as a living document that requires regular updates.
🤝 Cross-Functional Collaboration
Building the map is a team sport. When different departments contribute, the map becomes more accurate. However, this can lead to conflicts. Here is how to manage collaboration effectively.
- Facilitate Workshops: Bring teams together to build the map collaboratively. This ensures buy-in.
- Respect Data: Let the customer data drive the discussion, not opinions.
- Document Decisions: Keep a record of why certain paths were chosen or assumptions made.
- Encourage Openness: Create a safe space where team members can admit where the process failed without fear of blame.
🛠️ Practical Tips for Execution
To make the process smoother, consider these practical tips.
- Start Small: Map a single critical journey before attempting to map the entire ecosystem.
- Use Sticky Notes: If working physically, use sticky notes to allow for easy movement and rearrangement of touchpoints.
- Keep it Simple: Avoid overcomplicating the visual. If it is hard to read, it is hard to use.
- Focus on the User: Constantly ask, “What does this look like from the customer’s perspective?”
- Validate with Users: After drafting, show the map to actual customers to see if it matches their reality.
🔄 Iteration and Evolution
As mentioned, the map must evolve. Set a schedule for review. Quarterly reviews are often effective. During these reviews, update the data and check if new touchpoints have emerged.
For instance, if a new social media platform becomes popular among your target demographic, add a touchpoint for that channel. If a specific feature is removed, update the “Purchase” or “Usage” stages accordingly.
This iterative process ensures that the map remains relevant and useful for decision-making over time. It becomes a strategic asset rather than a one-time project.
📈 The Long-Term Impact
When done correctly, a customer journey map transforms the culture of an organization. It moves the focus from selling products to solving problems. Teams start to anticipate needs rather than react to issues.
Over time, this leads to higher retention, increased loyalty, and stronger brand reputation. The investment in mapping pays dividends through improved efficiency and customer satisfaction. It is a foundational element of a customer-centric organization.
By following these steps, you can build a map that not only documents the current state but also guides the future direction of your customer experience strategy.

