
Architecting DFDs with Visual Paradigm AI: A Step-by-Step VPasCode Guide
In the realm of complex system design and product management, clear data visualization is paramount for ensuring team alignment and successful technical implementation. Data Flow Diagrams (DFDs) serve as a cornerstone tool for system analysts and product managers, providing a graphical representation of how data moves through an information system. However, manually creating detailed, multi-level DFDs is often time-consuming and prone to logical inconsistencies across different hierarchy levels.
This guide explores the systematic approach to modeling an “Online Order Process,” moving from a high-level Context Diagram down to granular Level 3 details. We will examine how to leverage the Visual Paradigm AI Chatbot and VPasCode to automate this hierarchy while maintaining structural integrity.
1. The Foundation: Defining the System Boundary
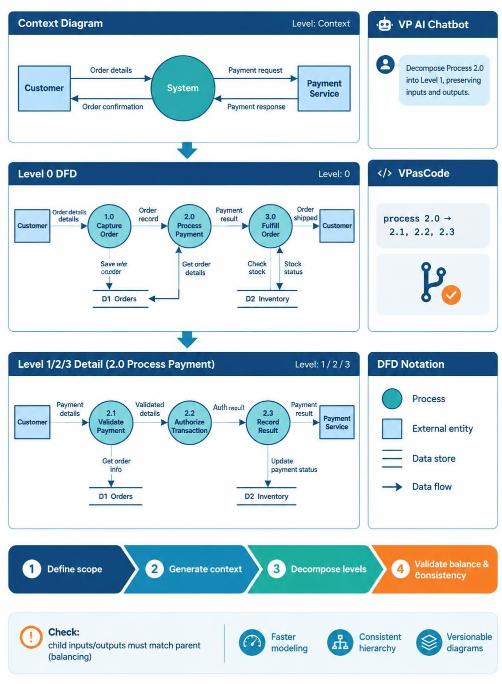
The journey of a Data Flow Diagram begins with the Context Diagram (often referred to as Level 0 in some methodologies, though here distinguished as the highest level abstraction). The primary goal of this diagram is to define the system boundary—what is inside the system and what is outside.
- External Entities: Represented by rectangles, these are actors outside the system that interact with it. In our order process, these are the Customer and the Payment Service.
- The System: Represented by a central circle, this encapsulates the entire application logic.
- Data Flows: Arrows representing the movement of information. For example, “Order details” flow from the Customer to the System, and “Payment response” flows from the Payment Service to the System.
At this stage, the internal mechanics are hidden. The system is a “black box” that takes inputs and produces outputs. This high-level view is crucial for stakeholder alignment before diving into the weeds.
2. Decomposition: The Art of Top-Down Design
Once the system boundary is established, we apply the principle of Top-Down Decomposition. This involves breaking the central system circle into its constituent sub-processes. This creates the Level 0 DFD.
Identifying Key Processes
By analyzing the flow of data in the Context Diagram, we can derive the necessary sub-processes:
- 1.0 Capture Order: Required to receive “Order details” and save them.
- 2.0 Process Payment: Required to handle the financial transaction.
- 3.0 Fulfill Order: Required to ship the product to the customer.
Each of these processes interacts with Data Stores (represented by open-ended rectangles), such as D1 Orders and D2 Inventory. This level provides a “Big Picture” of the system’s workflow without overwhelming the viewer with granular logic.
3. Refinement: From Level 0 to Level 1/2/3
As complexity increases, a single Level 0 diagram may become too crowded to be useful. This is where we zoom in on specific processes. Let’s look at Process 2.0: Process Payment in detail.
To maintain the integrity of the data flow, we must decompose Process 2.0 into its own sub-processes:
- 2.1 Validate Payment: Checks if the payment method is valid.
- 2.2 Authorize Transaction: Communicates with the bank or payment gateway.
- 2.3 Record Result: Updates the order status based on the authorization.
This drill-down approach ensures that every input entering a parent process (like “Payment details”) has a corresponding output and data flow in the child diagram. This concept is known as Balancing.
4. Leveraging AI and VPasCode for Efficiency
Manually creating these relationships is prone to error. The modern workflow utilizes the Visual Paradigm AI Chatbot to accelerate this process.
AI-Assisted Decomposition
Instead of drawing boxes manually, you can instruct the AI Chatbot to “Decompose Process 2.0 into Level 1, preserving inputs and outputs.” The AI analyzes the context and generates the logical sub-processes, ensuring that no data flow is lost in translation. This allows the analyst to focus on logic rather than drawing shapes.
Diagram-as-Code (VPasCode)
For users who prefer precision and version control, Visual Paradigm offers VPasCode. This allows you to define diagrams using a code-based syntax. This is particularly useful for automated generation and scripting.
For example, defining a process and its decomposition can be done via a structured script:
// Define the parent process
process 2.0 as "Process Payment" {
    // Define inputs and outputs
    input "Payment details" from "Customer"
    output "Payment result" to "Payment Service"

    // Define decomposition
    decompose into:
    2.1 as "Validate Payment"
    2.2 as "Authorize Transaction"
    2.3 as "Record Result"

    // Connect data stores
    store "D2 Inventory"
}
Using VPasCode ensures that your diagrams are reproducible and can be managed like software code, allowing for easy updates and collaboration.
5. Validating Consistency
The final step in the workflow is validation. A common pitfall in DFD creation is “Balancing” errors, where a child diagram introduces new inputs or outputs that did not exist in the parent diagram.
Visual Paradigm provides built-in checks to ensure:
- Child inputs/outputs match parent inputs/outputs: Ensuring the decomposition is mathematically consistent.
- Consistent Hierarchy: Ensuring naming conventions remain uniform across levels.
By combining fundamental modeling theory with AI-assisted tools, you can create robust, scalable, and logically sound system architectures in a fraction of the time required by traditional methods.