
Master Flowcharts with AI & VPasCode: A Stepwise Refinement Guide
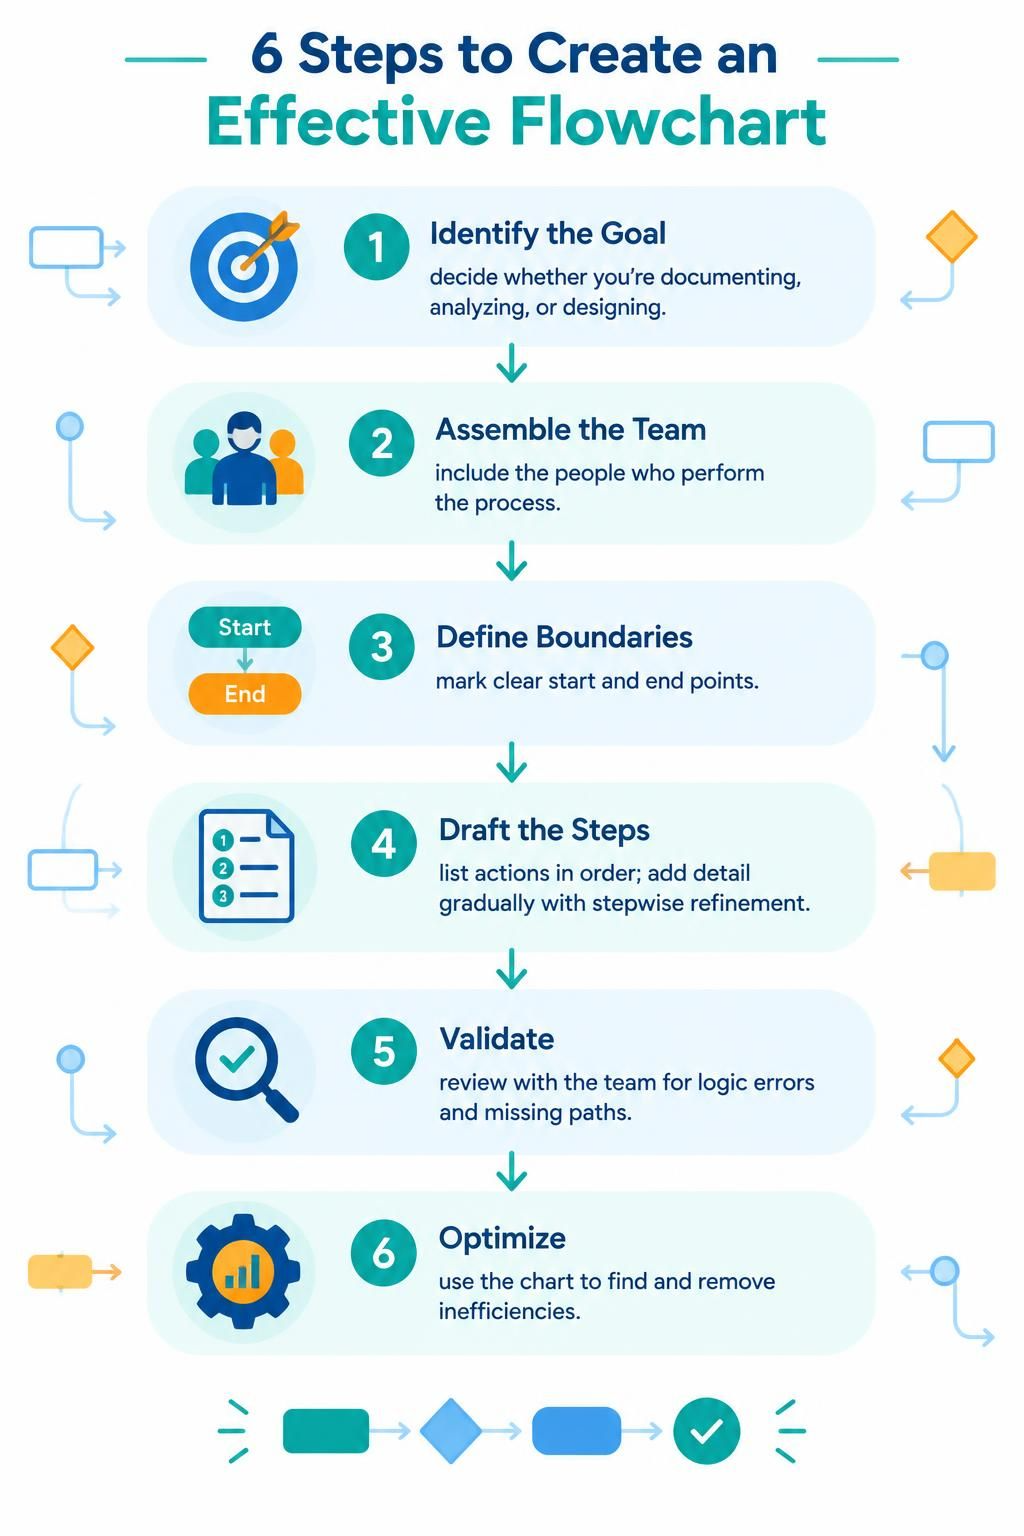
In the world of systems analysis and business process management, clarity is currency. A well-crafted flowchart does more than just visualize a process; it serves as a universal language that bridges the gap between technical constraints and business objectives. By leveraging the robust capabilities of Visual Paradigm, particularly its AI-assisted features and the VPasCode tool, you can transform complex workflows into streamlined, professional diagrams in a fraction of the traditional time.
The Philosophy of Stepwise Refinement
Creating an effective flowchart is rarely a linear path from start to finish; it is an iterative process of abstraction and detail. This concept, known as stepwise refinement, allows you to begin with high-level decisions and gradually drill down into specific actions without overwhelming the reader or the system designer.
Visual Paradigm supports this methodology by offering a flexible environment where you can rapidly prototype structures using drag-and-drop interfaces, and then refine them using advanced formatting tools. When combined with AI assistance, this approach ensures that your diagrams are not only logically sound but also visually optimized for readability.
Step 1: Identify the Goal
Before drawing a single shape, you must establish the why. Are you documenting an existing process for compliance, analyzing a bottleneck for efficiency, or designing a new system architecture? The goal dictates the level of detail required.
- Documentation: Requires strict adherence to actual process steps.
- Analysis: Focuses on data flow and decision points.
- Design: Allows for hypothetical paths and future-state modeling.
Step 2: Assemble the Team
A flowchart is a collaborative artifact. To ensure accuracy, you must include stakeholders who actually perform the process. These individuals provide the “ground truth” that prevents your diagram from becoming a theoretical exercise detached from reality. In Visual Paradigm, this collaboration is often streamlined through shared repositories and real-time editing features.
Step 3: Define Boundaries
Scope creep is the enemy of a clear diagram. You must clearly mark the Start and End points. This establishes the context for the entire model.
Visual Paradigm simplifies this through its standard UML and BPMN symbols. By using specific “Start” and “End” terminators, you create a visual anchor that guides the viewer’s eye through the logic of the system.
Step 4: Draft the Steps (The Core)
This is where the “meat” of the flowchart is built. You list actions in sequence, using stepwise refinement to add detail gradually. This is the stage where AI-Assisted Diagramming truly shines.
Leveraging AI for Drafting
Instead of manually dragging and dropping every connector, you can utilize the Text-to-Diagram capability within Visual Paradigm. Simply describe your process in natural language, and the AI generates the initial structure. For example:
// Conceptual logic for a user login flow
IF user_input == valid THEN
  Check database for credentials;
  IF credentials_match THEN
    Grant Access;
  ELSE
    Show Error;
  END IF;
ELSE
  Show Syntax Error;
END IF;
The tool then converts this logic into a visual representation, offering Smart Suggestions for next steps and automatically identifying missing connections based on common patterns.
Step 5: Validate
Once the draft is complete, the validation phase is critical. Walk through the chart with your team to check for logic errors, missing paths, or “dead ends.” A robust flowchart must account for exceptions and alternative routes, not just the “happy path.” Visual Paradigm’s alignment tools help ensure that the visual flow is intuitive, reducing the cognitive load required to understand the diagram.
Step 6: Optimize
The final step is optimization. Use the flowchart to identify and eliminate inefficiencies. Does a loop run too many times? Is a decision point ambiguous? By visualizing the process, you can often spot bottlenecks that are invisible in text-based descriptions. The automated layout features of the tool can also reorganize complex diagrams to reduce clutter, making optimization easier to spot.
Conclusion
By following these six steps and integrating the speed of AI-assisted tools, you can create comprehensive process maps that are both technically accurate and visually compelling. Whether you are using the drag-and-drop interface for rapid prototyping or the text-to-diagram feature for quick conceptualization, Visual Paradigm provides the robust suite of tools needed to master the art of flowcharting.