
Introduction
In the complex world of software development, clarity is king. Before a single line of code is written, successful projects rely on robust architectural planning and clear communication among stakeholders. Unified Modeling Language (UML) serves as the universal blueprint for software systems, allowing teams to visualize, specify, construct, and document the artifacts of a software-intensive system.
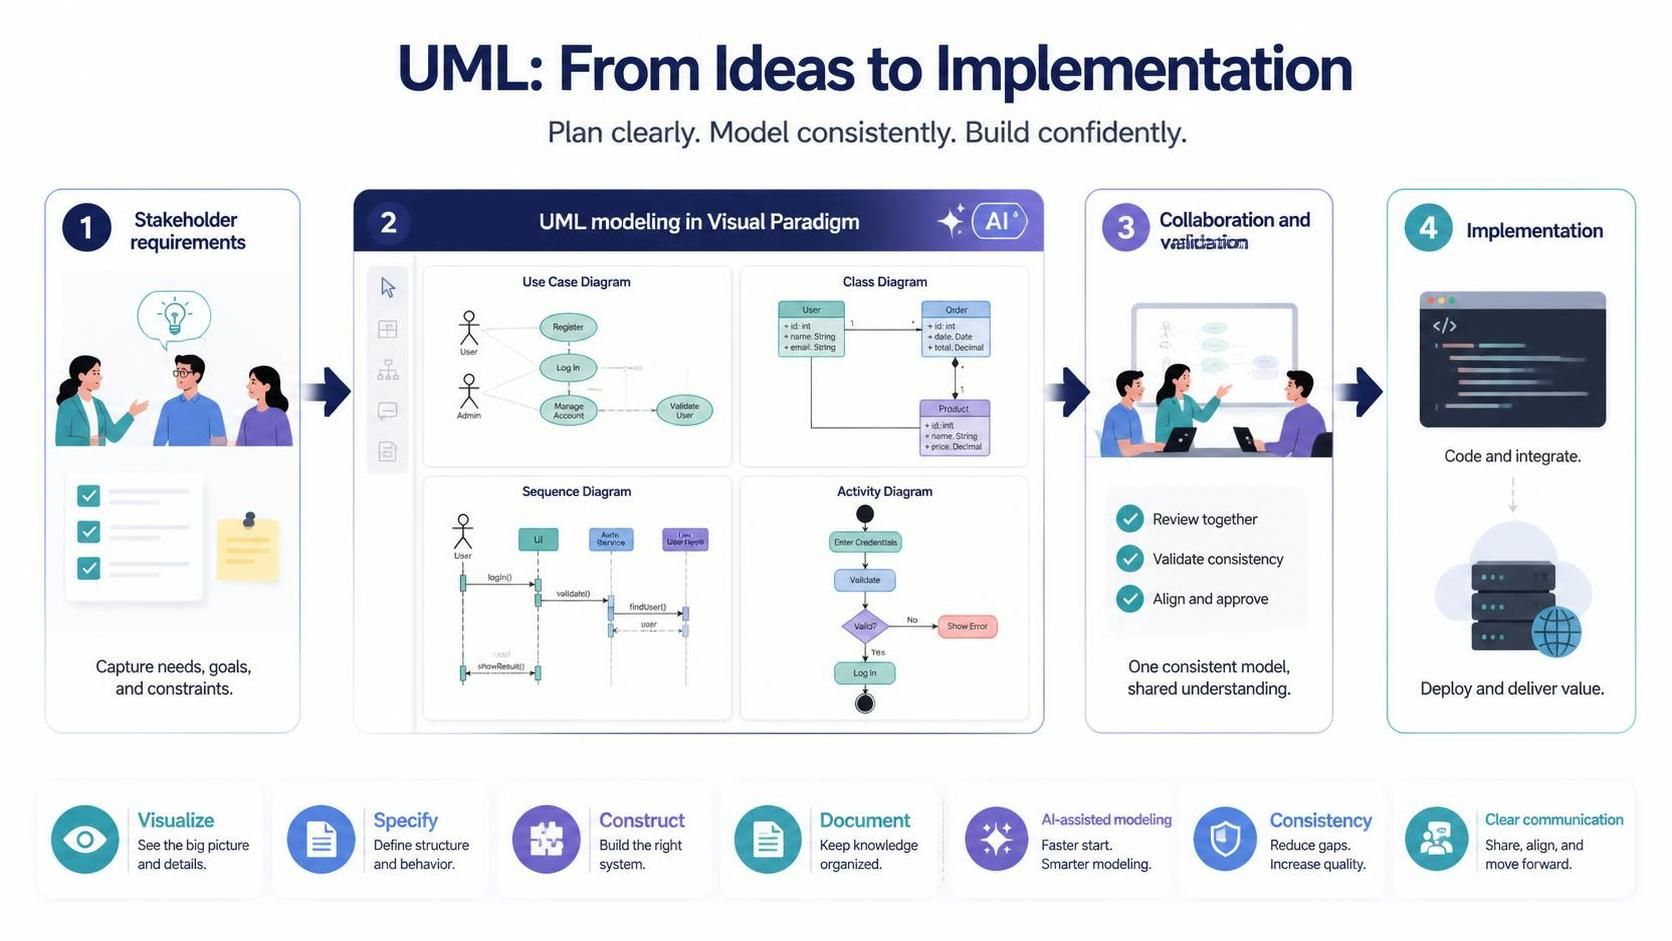
However, creating these diagrams manually can be time-consuming and prone to inconsistency. This is where Visual Paradigm steps in. As an award-winning UML software, Visual Paradigm not only provides a comprehensive suite of diagramming tools but also integrates cutting-edge AI capabilities to accelerate the modeling process. This guide explores how to leverage Visual Paradigm’s UML toolset to create precise, professional models that bridge the gap between abstract requirements and concrete implementation.

Structural Diagrams: Defining the System Skeleton
Structural diagrams focus on the static aspects of the system—what things must exist in the system being modeled. They provide the “blueprint” of your application.
Class Diagram
The class diagram is arguably the most widely used UML diagram in object-oriented programming. It models the structure of a system by showing its classes, their attributes, operations (methods), and the relationships among objects.
-
Key Concept: Think of the class diagram as the skeleton of your code. It defines the data structures and the logic containers before implementation begins.
-
Example: In an e-commerce system, you might have classes like
Customer,Order, andProduct. The diagram would show that aCustomerhas manyOrders, and anOrdercontains multipleProducts.

Object Diagram
While class diagrams show the general structure, object diagrams provide a snapshot of the system at a specific moment in time. They display instances of classifiers (objects) and their links.
-
Key Concept: Use object diagrams to validate your class diagram by testing specific scenarios with real-world data values.
-
Example: Showing a specific instance where
Customer: John Doehas placedOrder: #12345containingProduct: Laptop.

Component Diagram
Components diagrams model the physical parts of a software system. They show how larger components are built from smaller ones and how they interface with each other.
-
Key Concept: Ideal for visualizing the modular structure of large applications, such as microservices or library dependencies.
-
Example: A web application might have components for
Authentication Service,Payment Gateway, andUser Database, showing how they connect via APIs.

Deployment Diagram
This diagram models the physical deployment of artifacts on nodes (hardware). It bridges the gap between software and infrastructure.
-
Key Concept: Essential for DevOps and system architects to understand where software runs physically.
-
Example: Showing that the
Web Applicationartifact runs on aLinux Servernode, while theDatabaseartifact runs on a separateCloud Storagenode.

Package Diagram
For large-scale projects, package diagrams help organize elements into groups. They visualize the high-level structure and dependencies between subsystems or modules.
-
Key Concept: Use packages to manage complexity by grouping related classes or components together.
-
Example: Grouping all UI-related classes into a
Viewpackage, business logic into aControllerpackage, and data access into aModelpackage.

Composite Structure Diagram
This diagram visualizes the internal structure of a class or collaboration. It allows you to model a system from a micro point-of-view, showing parts and ports.
-
Key Concept: Useful for detailing complex classes that contain other objects or for defining interfaces within a component.

Profile Diagram
A profile diagram allows you to extend UML with stereotypes, tagged values, and constraints. It’s a way to customize UML for specific domains or industries.
-
Key Concept: Define custom icons, colors, and properties to make your diagrams more relevant to your specific business context.

Behavioral Diagrams: Capturing System Dynamics
Behavioral diagrams focus on what must happen in the system—the interactions, workflows, and state changes.
Use Case Diagram
Use case diagrams capture functional requirements from the user’s perspective. Each use case represents a high-level business goal that yields measurable value. Actors represent the roles interacting with the system.
-
Key Concept: Focus on who does what. Avoid technical details; stick to user goals.
-
Example: An actor
Bank Customerinteracts with use cases likeWithdraw Cash,Check Balance, andTransfer Funds.

Sequence Diagram
Sequence diagrams visualize interactions between objects over time. They show the sequence of messages passed between objects to achieve a specific functionality.
-
Key Concept: If the class diagram is the skeleton, the sequence diagram is the muscle movement. It details the programming logic required within methods.
-
Example: Showing the step-by-step message flow when a user clicks “Login”:
UIsends credentials toController, which validates withAuth Service, which queries theDatabase.

Communication Diagram
Formerly known as collaboration diagrams, these focus on the structural organization of objects that send and receive messages. Lifelines are connected to represent communication needs during runtime.
-
Key Concept: Emphasizes the spatial arrangement of objects and their links rather than the time sequence.
-
Example: Similar to the login example above, but focusing on which objects are linked and what messages traverse those links, without strict time ordering.

Activity Diagram
Activity diagrams are flowchart-based models used to describe the flow of control or data. They are excellent for modeling business processes or complex algorithms.
-
Key Concept: Use swimlanes to partition actions according to the participant (role or system) responsible for them.
-
Example: Modeling the order fulfillment process:
Customerplaces order ->Warehousepicks item ->Shippingdispatches item ->Customerreceives notification.

State Machine Diagram
Critical for event-driven systems, state machine diagrams show the various states an object can be in and the triggers that cause state transitions.
-
Key Concept: Ensures error-free logic by defining exactly how an object responds to events in different states.
-
Example: An
Orderobject might have states likeNew,Paid,Shipped, andDelivered. An eventPayment Receivedtriggers the transition fromNewtoPaid.

Timing Diagram
Timing diagrams model the behavior of objects over a specific period. They are particularly useful for real-time and distributed systems where timing constraints are critical.
-
Key Concept: Focuses on the change of state or condition along a linear time axis.
-
Example: Showing how a sensor’s value changes over milliseconds and how the system responds within a specific time window.

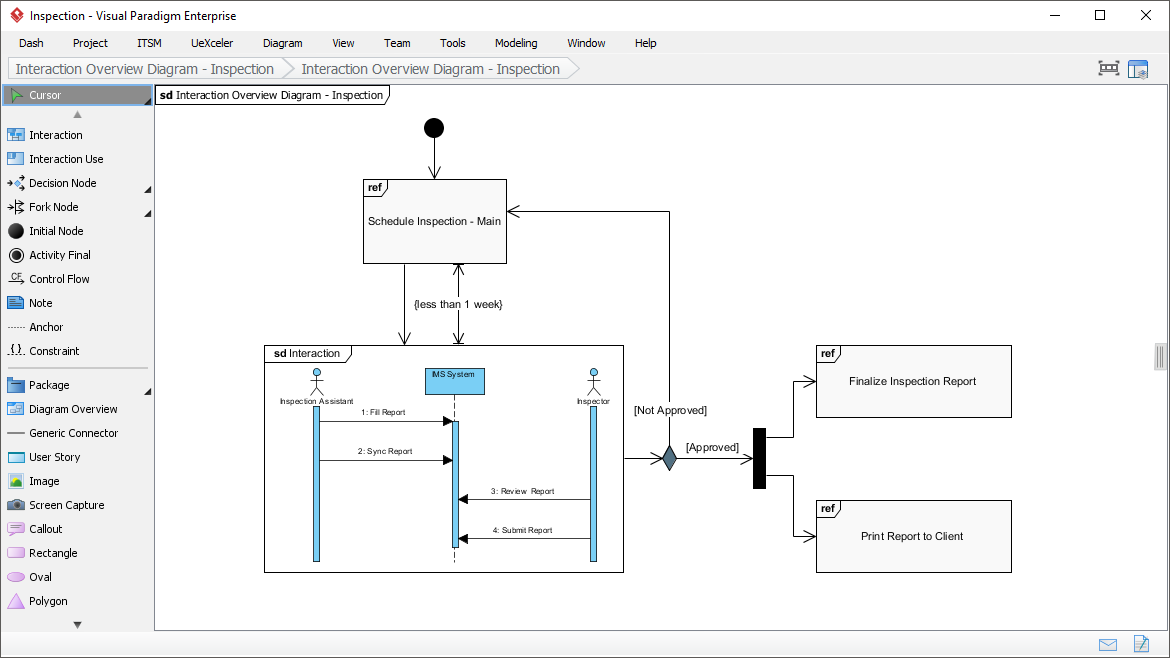
Interaction Overview Diagram
This diagram provides a high-level view of complex interactions by combining multiple sequence diagrams. It acts as a roadmap for intricate scenarios.
-
Key Concept: Use this to break down a massive interaction into manageable chunks, linking them together logically.
Advanced Features: Enhancing Your Models
Model Element Referencing
Visual Paradigm allows you to create rich, interconnected models by referencing elements across different diagrams and documents.

-
Internal References: Link diagrams, shapes, and model elements within your project. These links remain active in generated documentation.
-
External References: Connect your software design to business documents (e.g., requirements specs) to trace why certain design decisions were made.
-
Visual Indicators: Tiny markers appear in shape bodies to indicate that references have been added, allowing for quick visual audits.
-
Rich Text Integration: Insert model element references directly into descriptions, ensuring that your documentation stays synchronized with your diagrams.
Architecture Meets Intelligence: AI-Powered UML Modeling
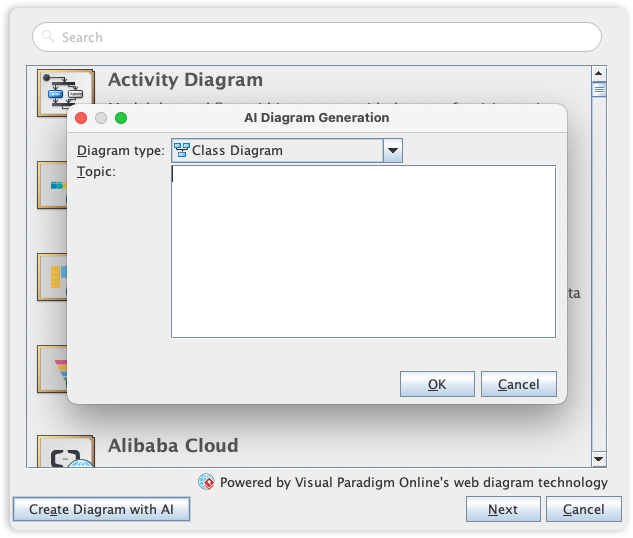
Visual Paradigm is elevating the modeling experience by integrating comprehensive UML support into its AI Diagram Generator. This feature allows you to generate diagrams from simple textual descriptions, saving hours of manual drafting.
-
Supported Diagrams: Instantly generate Use Case, Class, Sequence, State Machine, Requirement, and Object Diagrams.
-
How it Works: The AI interprets your natural language requirements, maps out entities and relationships, and produces a draft diagram. You can then refine and validate the architecture.
-
Benefit: Move directly to design validation rather than starting from a blank canvas.
Beyond UML: A Holistic Modeling Ecosystem
While UML is central to software design, Visual Paradigm offers a broader suite of tools to support every aspect of project lifecycle management.

Enterprise Architecture

Project Management

Visual Modeling

Agile & Scrum

Business Modeling

User Experience Design

Visual Diagramming

Code Engineering

Team Collaboration

Analysis & Charting

Advanced Modeling Tools

Project Mgmt. Diagram
Conclusion
Mastering UML modeling is not just about drawing boxes and lines; it’s about communicating complex ideas clearly and ensuring that your software architecture is robust, scalable, and aligned with business goals. With Visual Paradigm, you gain access to an industry-standard toolset that covers every aspect of modeling—from structural class diagrams to behavioral sequence diagrams, and even advanced AI-powered generation.
By leveraging these tools, teams can reduce ambiguity, catch design flaws early, and accelerate the development lifecycle. Whether you are a solo developer, a system architect, or part of a large enterprise team, Visual Paradigm provides the flexibility and power needed to turn your vision into a well-documented, implementable reality. Start modeling smarter, not harder, and let your diagrams drive your success.
Reference
-
Visual Paradigm Community Edition: Enterprise-Grade UML Modeling, Free Forever: Official introduction to the free Community Edition, highlighting full UML 2.x support, SysML, and ERD for non-commercial use .
-
Mastering Sequence Diagram Modeling: A Practical Approach: A guide to creating sequence diagrams with practical examples like order processing, conditional behavior, and exception handling .
-
Practical 3: Structural Implementation: A step-by-step tutorial for building class, component, and deployment diagrams using a Library Management System example .
-
UML in the Age of AI: How Visual Paradigm’s Ecosystem Is Reviving Visual Modeling (2025): Explores AI-powered features like natural language-to-UML, code-to-diagram, and an AI chatbot for design iteration .
-
How to Create UML Use Case Diagram in Visual Paradigm: A detailed, step-by-step guide covering actors, system boundaries, use cases, and include/extend relationships .
-
UML Tool Visual Paradigm Edition Feature Comparison: A comprehensive comparison table of the Community, Standard, Professional, and Enterprise editions, detailing differences in code engineering and team collaboration .

