
Mastering UML Deployment Diagrams with Visual Paradigm
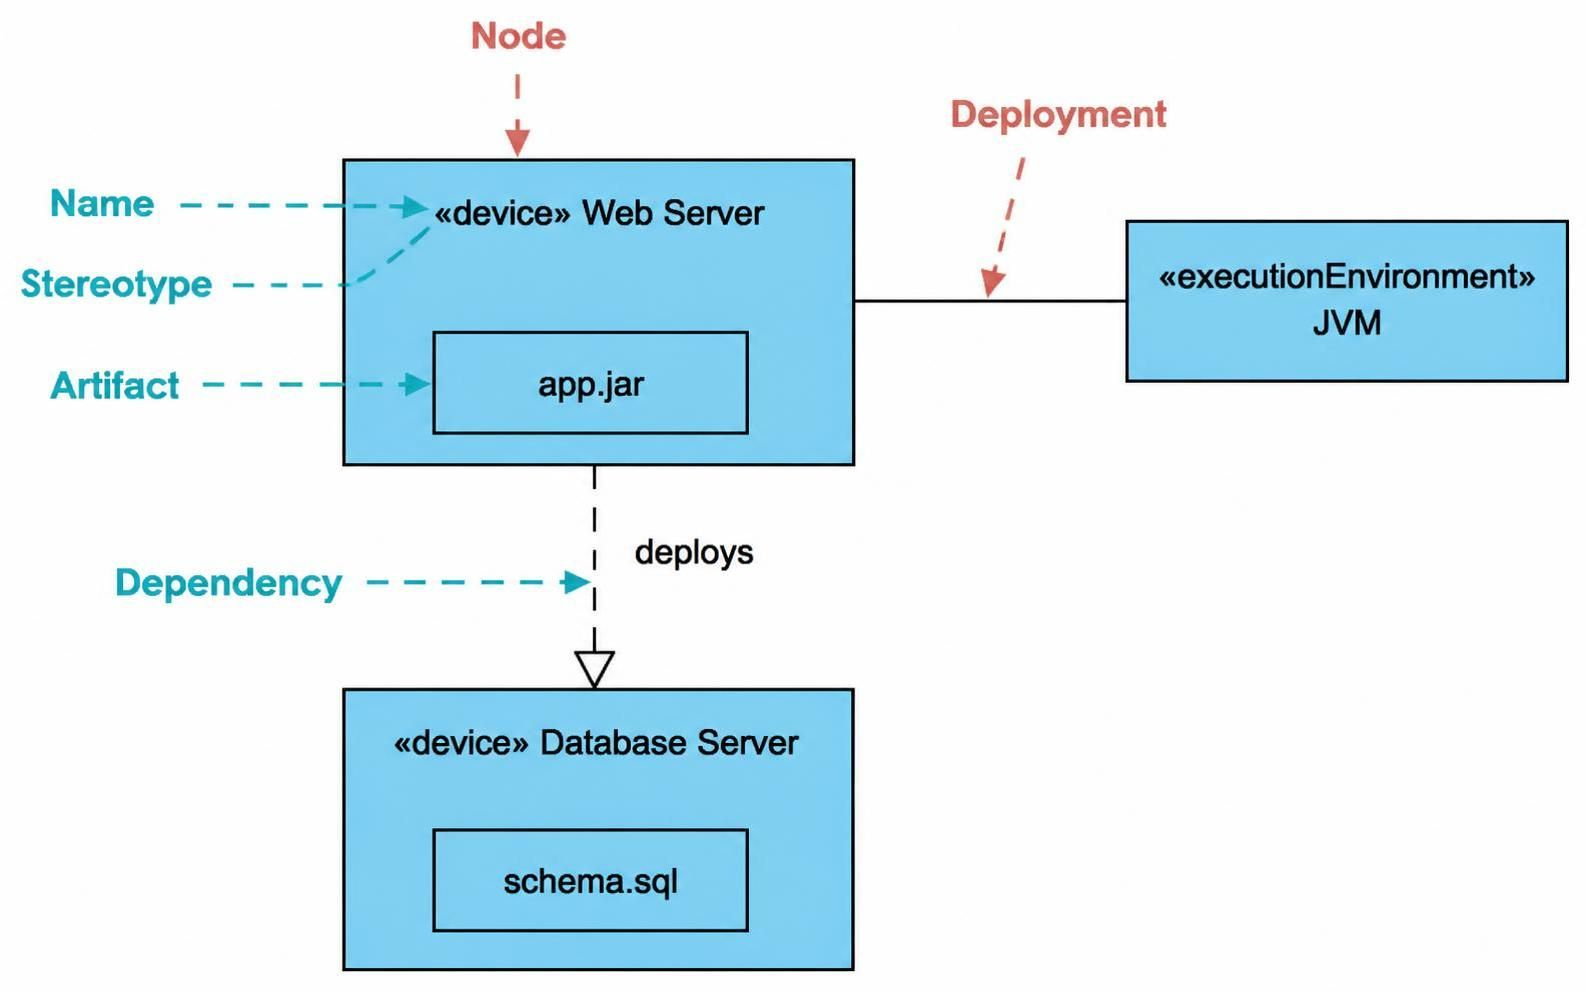
In the lifecycle of software development, understanding how your code moves from a developer’s machine to a live server is critical. This is where Deployment Diagrams come into play. They provide a high-level view of the physical architecture of your system, mapping out the hardware nodes, execution environments, and software artifacts that make up your infrastructure.
Whether you are architecting a microservices platform or a monolithic application, visualizing the deployment topology helps teams identify bottlenecks, ensure proper resource allocation, and streamline the DevOps pipeline.
Core Concepts of Deployment Diagrams
A Deployment Diagram is essentially a map of your system’s runtime environment. It focuses on the “where” and “how” of your software execution. Unlike Class Diagrams which describe the logical structure, Deployment Diagrams describe the physical structure.
1. Nodes (The Hardware)
Nodes represent the physical or virtual computing resources where your software runs. These are the “computers” in your architecture. In the diagram below, we see two distinct nodes:
- Web Server: The hardware or virtual machine hosting the web application.
- Database Server: The dedicated node storing persistent data.
Nodes are typically stereotyped as «device» in UML, indicating a physical processing element.
2. Artifacts (The Software)
Artifacts represent the physical implementation units, such as executable files, libraries, database scripts, or configuration files. They reside inside nodes.
app.jar: Represents the compiled Java archive (the application code) deployed on the Web Server.schema.sql: Represents the database schema script deployed on the Database Server.
3. Execution Environments
Software artifacts rarely run in a vacuum; they require a specific runtime environment. The diagram shows a «executionEnvironment» labeled as JVM (Java Virtual Machine). This indicates that the app.jar is not running directly on the OS, but is interpreted by the Java runtime.
4. Relationships
Understanding the lines connecting these elements is crucial:
- Deployment (Solid Line with Open Arrow): This relationship indicates that one element is deployed into another. In our example, the JVM is deployed onto the Web Server node.
- Dependency (Dashed Line with Open Arrow): This indicates a dependency relationship. The diagram shows that the Web Server has a dependency on the Database Server, meaning the application cannot function without access to the database.
Modeling with Visual Paradigm (VP)
Visual Paradigm (VP) is the industry-standard tool for creating these diagrams. It supports the full Unified Modeling Language (UML) specification, making it easy to translate your architectural ideas into formal diagrams.
When using VP, you can define the properties of your nodes and artifacts, such as IP addresses, operating systems, or memory requirements, and generate deployment reports directly from your model.
@startuml
node "Web Server" as WebServer {
  artifact "app.jar"
  node "JVM" as JVM
  JVM --|> WebServer : deploys
}

node "Database Server" as DBServer {
  artifact "schema.sql"
}

WebServer ..> DBServer : deploys
@endumlPractical Application: The Order System
Let’s apply this to a real-world scenario. Consider an e-commerce Order Processing system. A deployment diagram would clearly show:
- The Load Balancer node directing traffic.
- The Application Server hosting the
order-service.jarrunning on a«executionEnvironment»likeTomcat. - The Database Server holding the
orders.dbartifact. - The Redis Cache Server node holding temporary session data.
By visualizing these connections, you can ensure that the Application Server has the necessary network access (dependencies) to talk to the Database and Cache servers.
Conclusion
Deployment diagrams are the final piece of the puzzle in the System Architecture modeling process. They ground your abstract design in physical reality. By mastering the concepts of Nodes, Artifacts, and Execution Environments, you ensure that your team has a clear, shared understanding of how the software will actually be hosted and run.