
Mastering UML Deployment Diagrams: Visualizing Physical Architecture
In the realm of Software Engineering and DevOps, understanding the theoretical design of a system is only half the battle. The other half is knowing exactly how that system will live, breathe, and interact with the real world. This is where the Deployment Diagram becomes an indispensable asset.
A Deployment Diagram provides a snapshot of the physical hardware and software artifacts that make up your system. Unlike class diagrams that focus on logical structure, deployment diagrams focus on the “where” and “how” of runtime execution.
Core Concepts: Nodes, Artifacts, and Associations
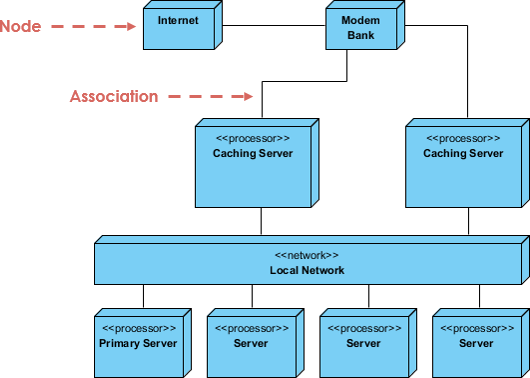
At its heart, a deployment diagram is a graph of physical resources. Let’s break down the anatomy of the system shown in the diagram below, which represents a typical banking or e-commerce infrastructure.
- Nodes (Hardware/Environment): These are the physical or virtual computing resources. In the diagram, we see Internet, Modem Bank, Caching Servers, and a Primary Server.
- Artifacts (Software): While not explicitly labeled with filenames, the nodes represent the deployment of specific software components. A “Server” node, for example, hosts the application code, database, and runtime environment.
- Connections (Communication): These lines represent the network paths through which data travels. In the diagram, you can see how the Local Network connects the servers to the external Modem Bank.
Understanding the distinction between a logical “Node” and the physical “Association” (connection) is vital. The dashed red line in the diagram labeled “Association” signifies the communication path between the external Internet and the internal Modem Bank.
Visualizing Infrastructure with Visual Paradigm
Visual Paradigm is a robust modeling tool that allows architects to move beyond abstract theory and create precise physical representations. When utilizing the core pillars of UML within Visual Paradigm, the deployment process becomes intuitive.
Step 1: Defining the Environment
Begin by selecting the “Deployment” tab. You will typically start by placing a “Node” element. In our scenario, we might start with the external entry point, the Internet, or the internal Local Network.
Step 2: Connecting the Hardware
Use the association tool to draw connections between nodes. Visual Paradigm automatically handles the “smart” connection logic, ensuring that when you add a new server, you can easily link it to the network backbone. This is crucial for visualizing the Modem Bank acting as a gateway.
Step 3: Adding Artifacts and Configuration
Once the nodes are in place, you can drag and drop software artifacts onto them. For instance, you can specify that the Caching Server nodes are running a specific Redis instance or a Memcached service. Visual Paradigm allows you to define the configuration of these nodes directly within the diagram properties.
@startuml
left to right direction
skinparam node {
  BackgroundColor Cyan
  BorderColor DarkBlue
  FontColor Blue
}

node "Internet" as Internet
node "Modem Bank" as Modem

node "[Processor] Caching Server" as Cache1
node "[Processor] Caching Server" as Cache2

node "[Network] Local Network" as LAN

node "[Processor] Primary Server" as Prim
node "[Processor] Server" as Srv1
node "[Processor] Server" as Srv2
node "[Processor] Server" as Srv3

Internet - Modem
Modem - Cache1
Modem - Cache2
Cache1 - LAN
Cache2 - LAN
LAN - Prim
LAN - Srv1
LAN - Srv2
LAN - Srv3
@enduml
The code block above demonstrates how you can programmatically define this exact architecture using PlantUML, which can then be imported or integrated into your Visual Paradigm workflow for rapid prototyping.
Why Visual Paradigm is Essential for DevOps
For DevOps teams, the gap between development and operations is often bridged by a lack of clear documentation. Visual Paradigm bridges this gap by providing a single source of truth.
- Collaboration: Multiple stakeholders can view the deployment topology simultaneously. The development team knows what to build, and the operations team knows where to deploy it.
- Scalability Planning: By visualizing the “Caching Servers” and “Primary Server” setup, you can immediately spot bottlenecks. If the traffic increases, do you need to add more nodes to the Local Network or upgrade the Modem Bank?
- Standardization: It enforces UML standards, ensuring that every architect and engineer reads the diagram the same way.
Conclusion
Deployment diagrams are not just drawings; they are blueprints for your infrastructure. By mastering the elements of Nodes, Artifacts, and Connections, and leveraging powerful tools like Visual Paradigm, you ensure that your system is not only logically sound but physically deployable, scalable, and maintainable.