Mastering Flowchart Logic: BPMN Symbols and AI-Driven Process Modeling
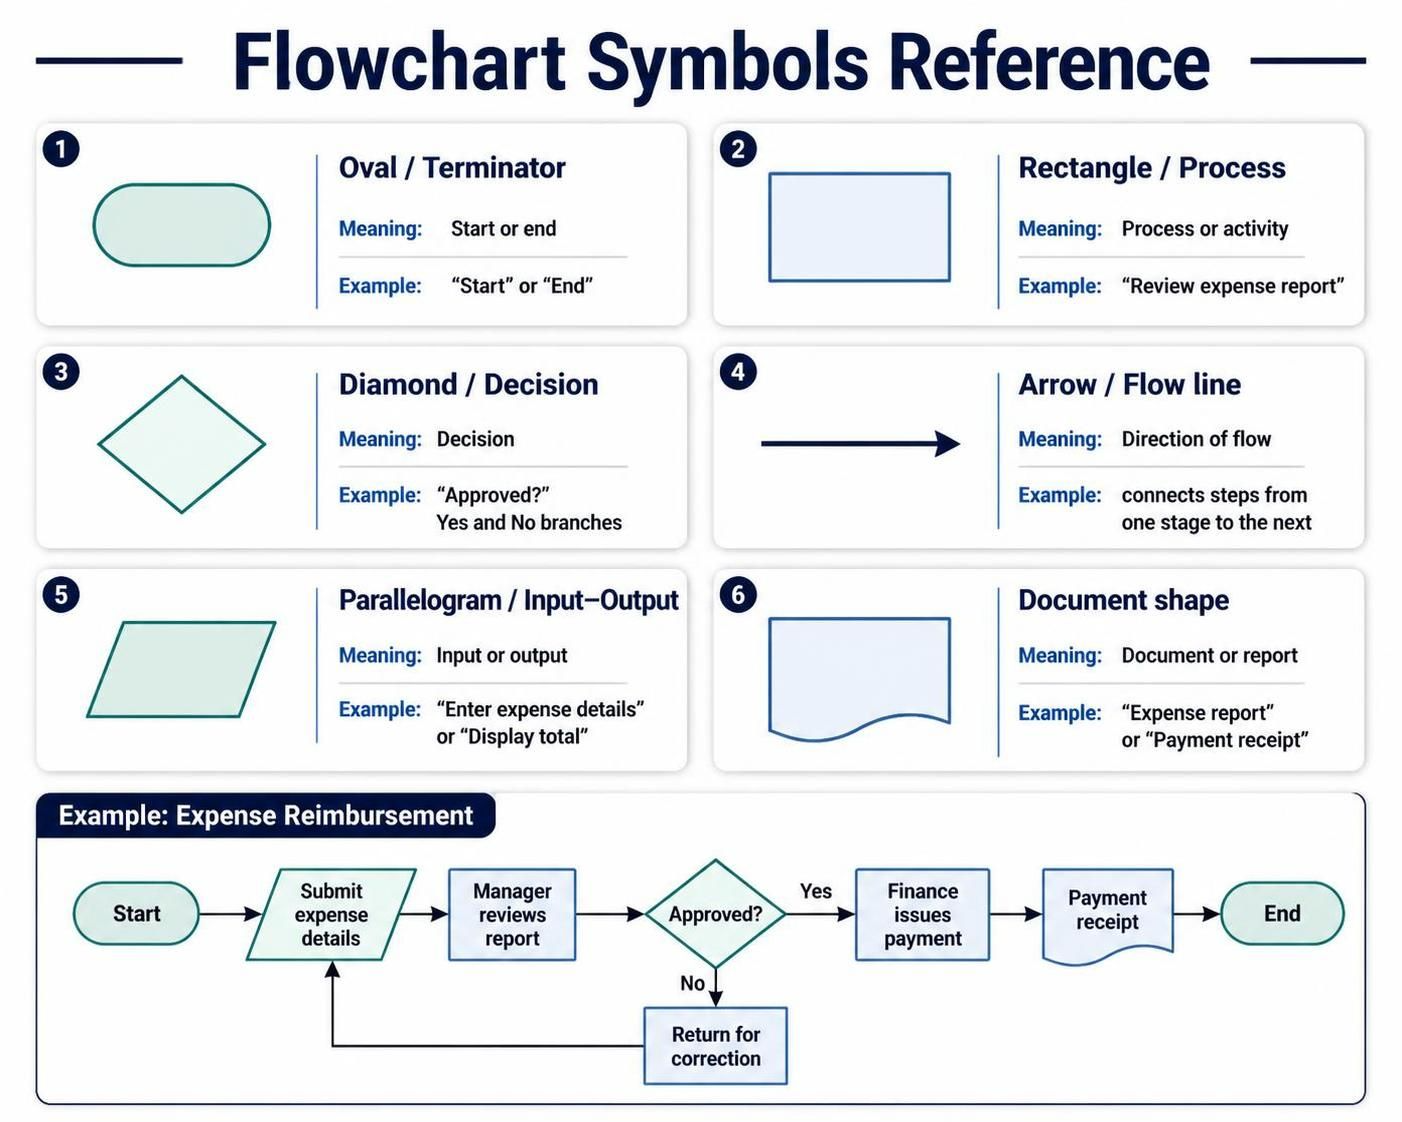
In the world of software engineering, business analysis, and operations management, clarity is king. A flowchart is the universal language used to translate complex logic into a visual narrative. As demonstrated in the reference diagram, these charts rely on a standardized set of geometric symbols to represent the lifecycle of a process, from its initiation to its conclusion.
This tutorial breaks down the fundamental architecture of flowcharts, explains the specific semantic meaning behind each shape, and explores how modern AI-assisted tooling transforms these static diagrams into dynamic collaboration engines.
1. The Anatomy of a Process: Core Symbols Explained
Before constructing a logical model, one must understand the vocabulary of the diagram. Each shape serves a distinct function in the narrative of the workflow.
- Oval (Terminator): This shape marks the boundaries of your process. It indicates the Start or End point. In a flowchart, you typically have exactly one start and one end (or multiple ends for different scenarios).
- Rectangle (Process): This represents an action, a task, or an activity. It is the workhorse of the diagram. For example, “Calculate Tax” or “Review Expense Report.”
- Diamond (Decision): This is the branching point of logic. It represents a question that must be answered (Yes/No, True/False). The flow splits based on the outcome of this decision.
- Arrow (Flow Line): Arrows dictate the sequence. They show the direction of the logic, connecting one step to the next. They are the “connective tissue” of the diagram.
- Parallelogram (Input/Output): This shape is used for data entering the system or results leaving it. Examples include “Enter User ID” or “Print Report.”
- Document Shape: This represents a physical document or a digital file generated by the process, such as a “Contract” or “Invoice.”
2. Case Study: The Expense Reimbursement Workflow
To understand how these symbols interact, let us analyze the logic of the Expense Reimbursement process shown in the diagram. This workflow demonstrates a classic looping mechanism triggered by a decision.
The Logic Flow
- Initiation: The process begins at the Oval labeled “Start”.
- Data Entry: The user performs an Input/Output action (Parallelogram) to “Submit expense details”.
- Processing: The system or manager performs a Process (Rectangle) to “Review expense report”.
- The Decision Gate: The flow reaches the Diamond asking “Approved?”.
The Branching Logic
Here, the workflow splits into two distinct paths:
- The “Yes” Path (Success): If approved, the flow moves to “Finance issues payment” (Process) and generates a “Payment receipt” (Document), finally terminating at the “End” Oval.
- The “No” Path (Exception Handling): If the report is not approved, the flow moves to “Return for correction” (Process). Crucially, an arrow loops this path back to the “Submit expense details” step. This creates a feedback loop, ensuring data quality before the process can conclude.
graph TD
    Start([Start]) --> Submit[Submit expense details]
    Submit --> Review[Manager reviews report]
    Review --> Decision{Approved?}

    Decision -- Yes --> Finance[Finance issues payment]
    Finance --> Receipt[Payment receipt]
    Receipt --> End([End])

    Decision -- No --> Correction[Return for correction]
    Correction --> Submit
3. Architecting for Efficiency: Visual Paradigm & AI
While manual drawing works for simple diagrams, modern enterprise architecture requires precision and speed. This is where the synergy between Visual Paradigm (VP) and BPMN (Business Process Model and Notation) becomes critical.
The Core Pillars of Modern Modeling
Visual Paradigm is not just a drawing tool; it is a comprehensive system architecture platform. When integrated with AI-assisted features, it shifts the paradigm from “drawing boxes” to “generating solutions.”
- Standardization (BPMN): BPMN provides the industry-standard grammar for flowcharts. By adhering to these rules, teams ensure that a diagram drawn by an analyst means the exact same thing to a developer or a stakeholder.
- AI-Assisted Features: AI tools within VP can generate flowcharts from natural language requirements. Instead of manually dragging shapes, a user can type, “Create a flowchart for an order process where payment is required,” and the AI constructs the logic tree instantly.
Boosting Collaboration and Productivity
The integration of these tools solves the “communication gap.”
- Real-time Collaboration: Teams can work on the same diagram simultaneously. Comments and version history track changes, ensuring everyone is working from the “single source of truth.”
- Model-Driven Development: In advanced usage, the flowchart isn’t just a picture—it’s executable code. The AI can scaffold the backend logic based on the decision diamonds, significantly reducing development time.
4. Conclusion
Mastering flowcharts is about more than geometry; it is about logical thinking. By understanding the semantic weight of shapes like the Diamond (Decision) and the Parallelogram (Input), and by leveraging AI-driven tools like Visual Paradigm, organizations can streamline their operations and build robust, error-free systems.