
Mastering BPMN 2.0: A Comprehensive Guide to Standardized Process Modeling
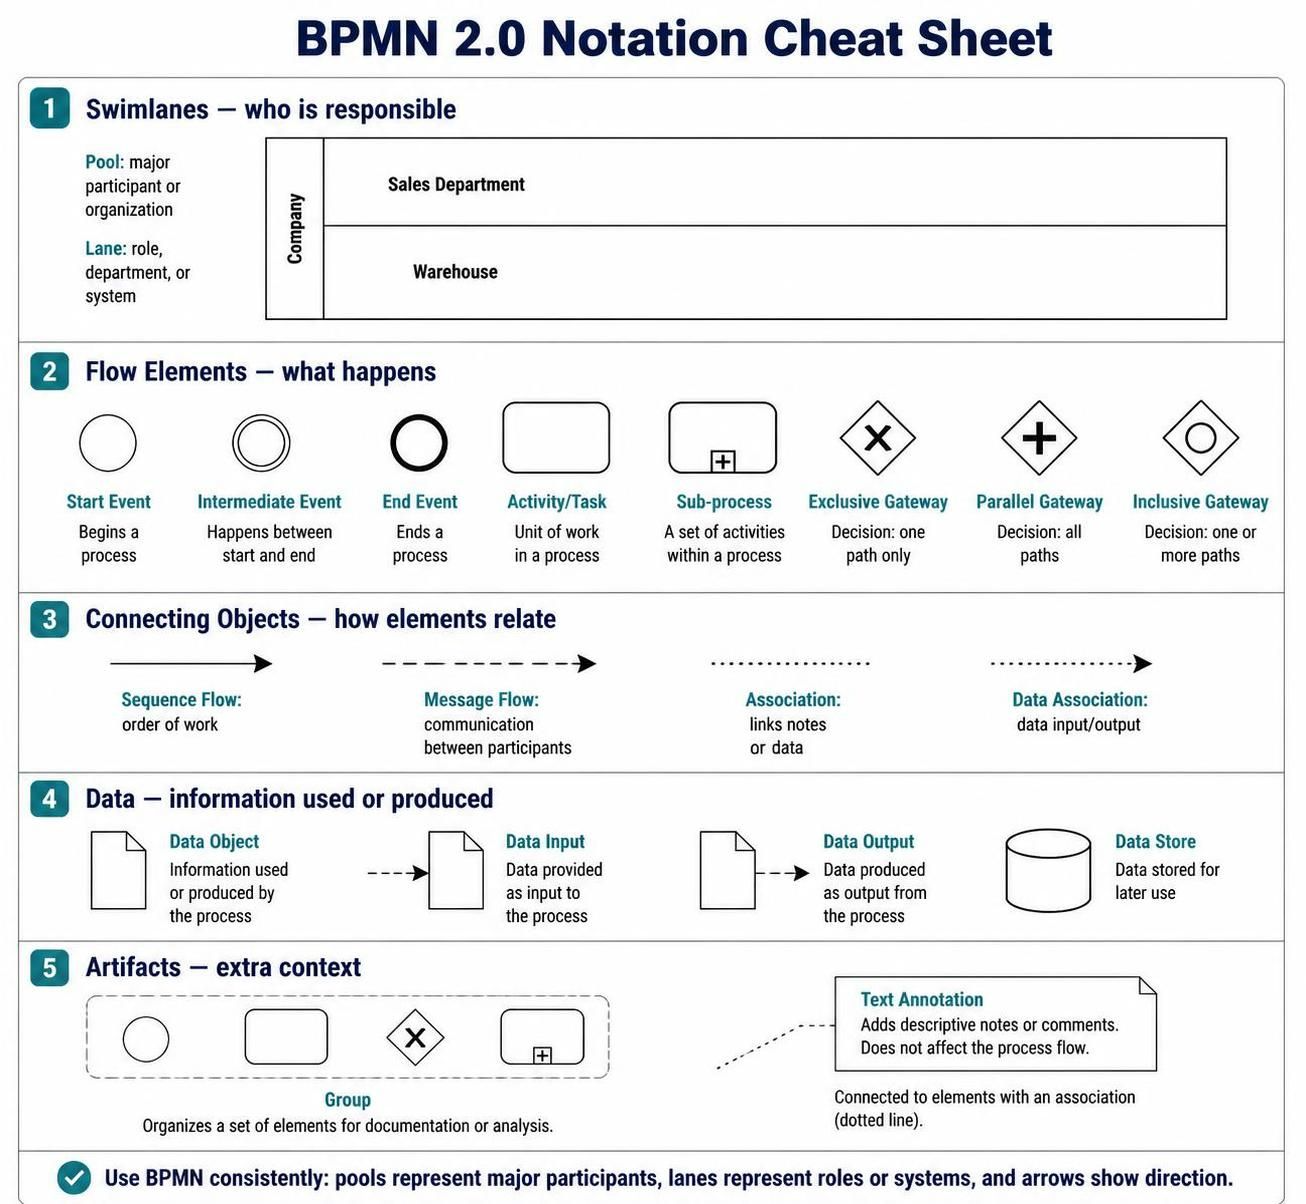
Welcome to this technical deep-dive into BPMN 2.0 (Business Process Model and Notation). In the modern enterprise, the gap between business strategy and IT execution is often bridged by a single visual language. BPMN provides that bridge. It allows business stakeholders, analysts, and developers to visualize complex workflows using a standardized set of symbols, ensuring that everyone “speaks the same language.”
This tutorial breaks down the five fundamental areas of BPMN architecture: Swimlanes, Flow Elements, Connecting Objects, Data, and Artifacts.
1. Swimlanes – Defining Responsibility
The foundation of any BPMN diagram is the organizational structure. We do not simply draw a process; we draw a process within an organization. This is achieved through Swimlanes.
Pool vs. Lane
Understanding the hierarchy of swimlanes is critical for context:
- Pool: Represents the top-level container. It typically depicts a major participant, such as an organization (e.g., “Company A”), a customer, or a distinct business entity. A pool can contain multiple lanes.
- Lane: Represents a subdivision within a pool. Lanes are used to categorize activities by role, department, or system. In the diagram, “Sales Department” and “Warehouse” are lanes within the “Company” pool, clearly delineating who is responsible for specific tasks.
Why Swimlanes Matter
Swimlanes prevent ambiguity. If a task appears in the “Warehouse” lane, it is immediately understood that the warehouse staff (or their automated system) must perform it. If a task spans across lanes, it indicates hand-offs or communication points between departments.
2. Flow Elements – The Heart of the Process
Flow elements describe what happens during the execution of a process. These are the building blocks of the actual work.
Events: The Triggers and Outcomes
Events are represented by circles. They signify something that happens, not something that is done.
- Start Event: The genesis of the process (e.g., “Order Received”). This triggers the workflow.
- Intermediate Event: An occurrence that happens between the start and end. It could be a timer (e.g., waiting 24 hours), a message (e.g., receiving a payment confirmation), or an error.
- End Event: The termination of the process (e.g., “Order Shipped”).
Activities: The Work Units
Activities are the actual tasks performed. They are represented by rounded rectangles.
- Task: The smallest unit of work that cannot be decomposed further in the current view (e.g., “Verify Credit Card”).
- Sub-process: A complex activity that can be expanded. It is a “black box” at a high level but contains its own detailed flow of tasks and events. This allows for hierarchical modeling.
Gateways: The Decision Points
Gateways control the divergence and convergence of the process flow. They are represented by diamonds.
- Exclusive Gateway (X): Represents a decision point where only one path is taken (e.g., If “Credit Approved” -> Yes, else -> No). This is an XOR split.
- Parallel Gateway (+): Represents a synchronization point where all paths must be completed before the process can continue. This is an AND split/join.
- Inclusive Gateway (O): Represents a choice where one or more paths can be taken based on conditions (e.g., “Ship via Ground” OR “Ship via Air” OR “Both”).
3. Connecting Objects – The Arrows of Logic
Connecting objects define how elements relate to one another. The direction and style of the line indicate the type of relationship.
- Sequence Flow: A solid line with a thin arrowhead. It defines the order of activities within a single pool (e.g., Task A happens, then Task B happens).
- Message Flow: A dashed line with a thin arrowhead. It represents communication between participants. If you see a Message Flow, it typically crosses the boundary of a Pool, indicating communication between different organizations or systems.
- Association: A dotted line. This links an artifact (like a text note) to a flow element without affecting the logic.
- Data Association: A dotted line with an open arrowhead. It explicitly links a data object to an activity, indicating input or output.
4. Data – Information in Motion
Processes do not exist in a vacuum; they consume and produce information. BPMN distinguishes between the flow of control and the flow of data.
- Data Object: A document icon representing information used or produced by a task (e.g., a “Sales Order” form).
- Data Input / Output: Specific arrows indicating that a task requires specific data to start (Input) or generates data as a result (Output).
- Data Store: A cylinder icon. This represents persistent storage (like a database or a filing cabinet) where data is stored for later use, distinct from transient data objects.
5. Artifacts – Context and Documentation
Artifacts provide extra context that helps explain the process but do not affect the flow logic itself.
- Text Annotation: A note attached to an element via a dotted line. It is used to add descriptive comments, business rules, or warnings.
- Group: A dashed rectangle used to visually organize a set of elements. It is useful for grouping related tasks for analysis or documentation purposes without implying a functional relationship.
Conclusion
Mastering BPMN 2.0 is about more than just drawing shapes; it is about modeling the precise logic, responsibilities, and data flows of an enterprise. By adhering to the standards of Pools, Lanes, Events, Gateways, and Data associations, organizations can create processes that are not only visual representations but executable blueprints.
To effectively implement and visualize these complex models, it is highly recommended to utilize Visual Paradigm BPMN as your primary tooling. Visual Paradigm offers a robust environment for creating, simulating, and managing BPMN diagrams. Furthermore, leveraging the integration of AI within Visual Paradigm can significantly accelerate the modeling process, helping to automatically generate process flows, suggest optimizations, and ensure notation consistency across your organization.