BPMN 2.0 Masterclass: Bridging the Gap Between Visual Design and Executable Performance
In the modern enterprise, the “translation gap” between business strategy and technical execution is often the primary cause of process failure. Business stakeholders describe workflows in text, while developers build them in code, leading to misinterpretation and technical debt. This is where Business Process Model and Notation (BPMN) 2.0 revolutionizes the landscape. It is no longer just a drawing standard; it is a rigorous, executable language that serves as the universal bridge between organizational intent and system implementation.
1. The Evolution: From Notation to Semantics
Historically, organizations struggled with legacy systems that created silos between departments. Early versions of BPMN were primarily a “shared notation”—a way to draw pictures that looked the same to everyone. However, the release of BPMN 2.0 marked a pivotal shift. It moved the standard from a simple visual language to a formal, executable standard.
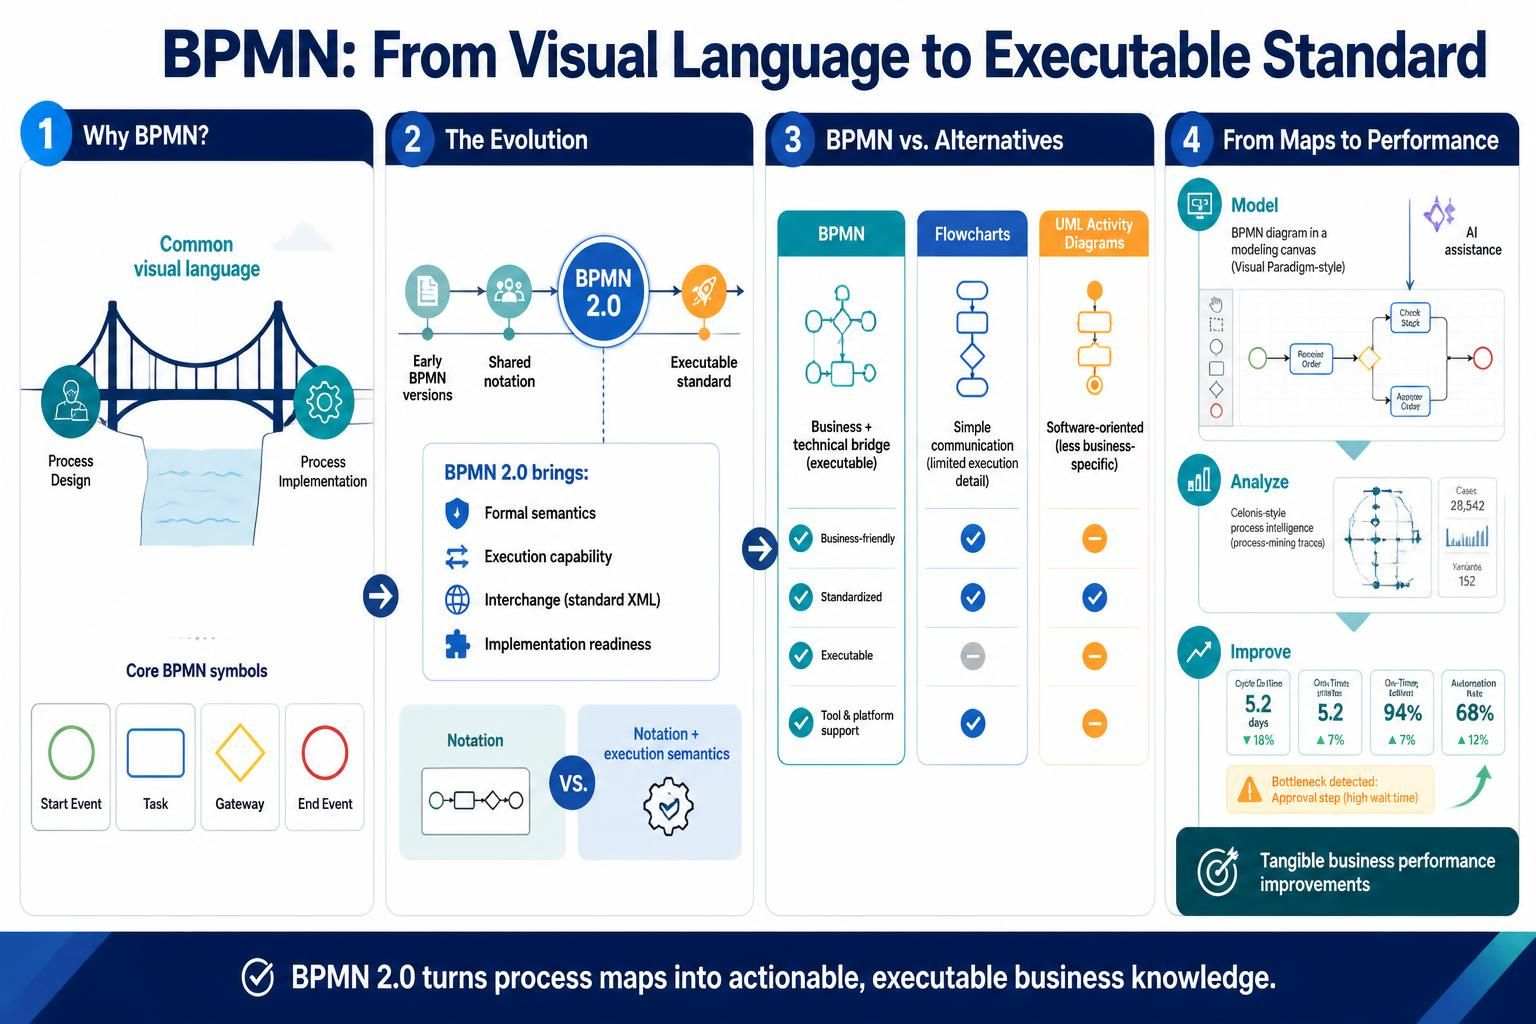
According to the industry evolution model, BPMN 2.0 introduced four critical pillars that earlier versions lacked:
- Formal Semantics: Every symbol has a defined mathematical meaning, removing ambiguity.
- Execution Capability: The diagrams can be directly executed by workflow engines without manual code rewriting.
- Interchange: Using standard XML (BPMN XML), models can be exchanged between different software tools without losing data.
- Implementation Readiness: The models are “production-ready” straight out of the design phase.
2. Core Symbols: The Vocabulary of Process
To master BPMN, one must understand its fundamental grammar. Unlike flowcharts that focus on logic flow, BPMN focuses on the lifecycle of a process instance. The core symbols form the foundation of every diagram:
Events: The “When”
Events are represented by circles. They do not do work; they simply mark a point in time.
- Start Event (Green Circle): The trigger that initiates the process.
- End Event (Red Circle): The conclusion of the process.
Activities: The “What”
Activities are represented by rounded rectangles (Tasks). This is where the actual work happens—whether performed by a human or a system.
Gateways: The “Decision”
Gateways are diamonds used to control the flow of the process. They determine which path the process takes based on data conditions (e.g., “If Approved” vs. “If Rejected”).
3. BPMN vs. Alternatives: Choosing the Right Tool
One of the most common questions in process architecture is how BPMN compares to standard software modeling tools like Flowcharts or UML Activity Diagrams.
- Flowcharts: Excellent for simple logic and software engineers, but they lack “business-friendly” semantics. They often fail to capture the human element of a process.
- UML Activity Diagrams: Highly “software-oriented” and focused on object states, but they are often too technical for business stakeholders to understand.
- BPMN 2.0: The “Sweet Spot.” It combines the Business-Friendly nature of a flowchart with the Executable rigor of UML. It is standardized, platform-independent, and ready for automation.
4. From Maps to Performance: The Modern Workflow
The true power of BPMN is realized when it is integrated with modern tooling and Process Intelligence. The workflow has evolved into a closed-loop cycle:
- Model: Design the process using a tool like Visual Paradigm. By leveraging AI assistance, architects can generate complex BPMN diagrams from natural language descriptions or existing documentation, drastically reducing design time.
- Analyze: Once the process is live, connect it to Process Intelligence platforms (like Celonis). These tools ingest “process-mining traces” from enterprise systems (ERP, CRM) to compare the theoretical “As-Is” model against the actual “To-Be” reality.
- Improve: The system identifies bottlenecks. For example, if the model predicts a 2-day approval cycle, but the data shows it actually takes 5.2 days, the system flags a deviation. This allows for tangible performance improvements, such as automating the approval step to increase the automation rate and reduce cycle time.
5. Architecture: The “Visual Paradigm” Ecosystem
Modern BPMN modeling is no longer a static drawing exercise. When utilizing tools like Visual Paradigm enhanced with AI, the architecture supports a dynamic lifecycle:
graph TD
    A[Business Requirements] -->|AI Assistance| B(BPMN 2.0 Model)
    B -->|Standard XML Export| C[Workflow Engine]
    C -->|Real-time Data| D[Process Mining]
    D -->|Bottleneck Detection| E[Performance Dashboard]
    E -->|Feedback Loop| B
In this architecture, the BPMN diagram is not just a document; it is a digital twin of the business. The integration of AI allows for rapid prototyping, while Process Intelligence ensures that the process remains optimized over time.
Conclusion
BPMN 2.0 has transformed process management from a theoretical exercise into a tangible asset. By bridging the gap between business stakeholders and technical implementers, and by integrating with AI and Process Intelligence, organizations can turn static maps into executable, high-performance business knowledge.