
Mastering Parallel Workflows: A Deep Dive into UML Activity Diagrams with Visual Paradigm
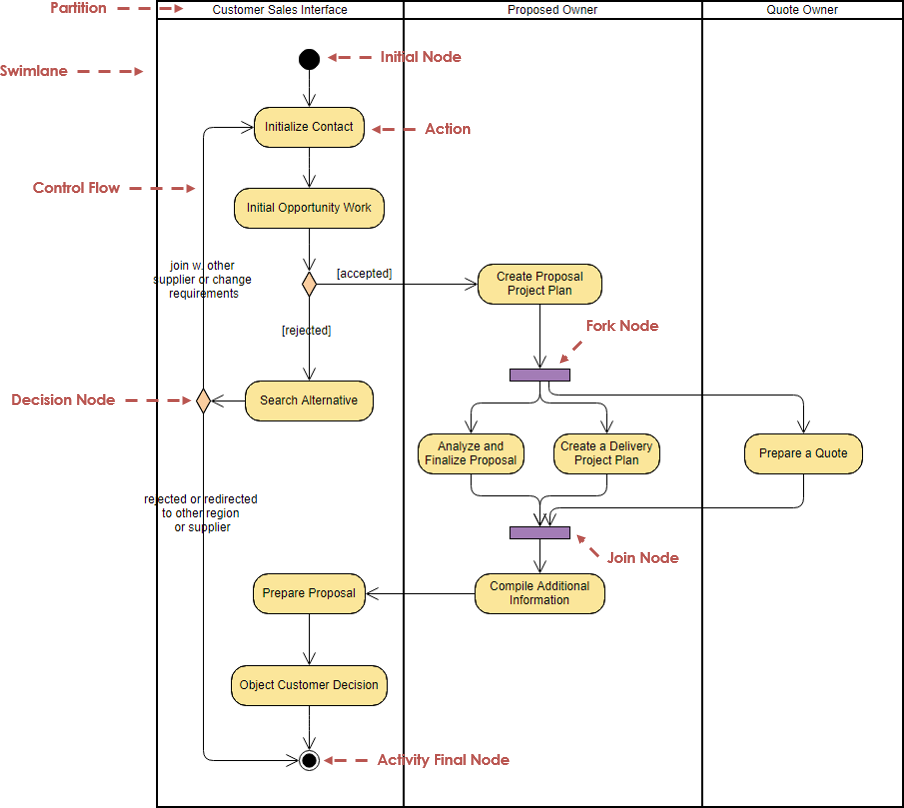
When analyzing complex business processes, a simple linear sequence of steps is rarely sufficient. Real-world scenarios—such as the sales-to-quote workflow depicted in our analysis—often require multiple teams to work simultaneously, make decisions, and synchronize their efforts. This is where the UML Activity Diagram becomes an essential tool for system architects and business analysts.
In this tutorial, we will dissect a complex business process diagram using Visual Paradigm. We will move beyond simple flowcharts to understand how to model parallelism, synchronization, and conditional logic, ensuring your system architecture accurately reflects the reality of your business operations.
1. Structuring the Process: Swimlanes and Partitions
The foundation of any readable activity diagram is its organization. In the provided diagram, we see the process divided into vertical sections known as Swimlanes or Partitions. These are labeled at the top:
- Customer Sales Interface
- Proposed Owner
- Quote Owner
Why Swimlanes Matter: Swimlanes are not just for aesthetics; they are critical for defining responsibility. They answer the question: “Who does what?” By isolating activities within a specific lane, you ensure that the “Customer Sales Interface” team knows exactly where their responsibility ends and the “Proposed Owner” team begins. This prevents ambiguity in cross-functional workflows.
2. The Lifecycle of an Activity
Tracing the flow from the top, the diagram illustrates a standard lifecycle of an activity:
- Initial Node: The process begins with a solid black circle. This is the entry point, representing the trigger event (e.g., a new sales inquiry).
- Actions: Represented by rounded rectangles (e.g., Initialize Contact, Initial Opportunity Work), these are the specific tasks performed within a swimlane.
- Control Flow: The arrows connecting these actions dictate the sequence. In the Customer Sales Interface lane, the flow is linear: from initializing contact to working on the opportunity.
3. Modeling Complexity: Decision Nodes
Business logic is rarely linear. It involves choices. The diagram introduces a Decision Node (a diamond shape) after the “Initial Opportunity Work” activity.
This node acts as a gateway for the process flow, splitting the path based on a condition:
- [accepted]: If the opportunity is accepted, the flow moves to the “Proposed Owner” swimlane to “Create Proposal Project Plan”.
- [rejected]: If rejected, the flow loops back to “Search Alternative”.
Notice the labels attached to the outgoing arrows. In UML Activity Diagrams, these are called Guard Conditions. They are enclosed in square brackets [] and define the boolean logic required to traverse a specific path.
4. Advanced Concept: Fork and Join Nodes
The most powerful feature of the Activity Diagram is its ability to handle concurrency. Look at the Proposed Owner swimlane. After the “Create Proposal Project Plan” action, you will see a thick purple bar. This is the Fork Node.
What is a Fork? A Fork splits a single incoming flow into multiple parallel flows. In our diagram, the process splits into three simultaneous activities:
- Analyze and Finalize Proposal
- Create a Delivery Project Plan
- Prepare a Quote
What is a Join? Parallel processes must eventually synchronize. The diagram shows another thick purple bar below the parallel activities, labeled as the Join Node. This node represents a synchronization point. The process cannot proceed to “Compile Additional Information” until all incoming parallel flows (the three activities mentioned above) have completed.
5. Visualizing the Full Workflow
By combining these elements, the diagram tells a complete story:
1. Start with Customer Sales Interface (Initial Node).
2. Perform "Initial Opportunity Work".
3. Decision: Is the opportunity accepted?
   - NO: Search for alternatives and re-evaluate.
   - YES: Move to Proposed Owner.
4. Proposed Owner creates a plan, then Forks into parallel tasks.
5. While tasks run in parallel (Analysis, Delivery Plan, Quote), the system waits.
6. Join Node: Once all parallel tasks finish, merge back to a single flow.
7. Compile Additional Information.
8. Return to Customer Sales Interface to "Prepare Proposal".
9. Finalize with "Object Customer Decision" and End.
This level of detail allows developers to understand exactly when threads need to be spawned (Fork) and when they need to be joined (Join) within the software architecture.
Conclusion
The UML Activity Diagram is far more than a static picture; it is a simulation of your business logic. By utilizing Swimlanes for responsibility, Decision Nodes for logic, and Fork/Join nodes for concurrency, you create a robust blueprint that guides both business stakeholders and technical developers toward a successful implementation.