
Mastering Custom Profile Diagrams: Extending UML with Stereotypes in Visual Paradigm
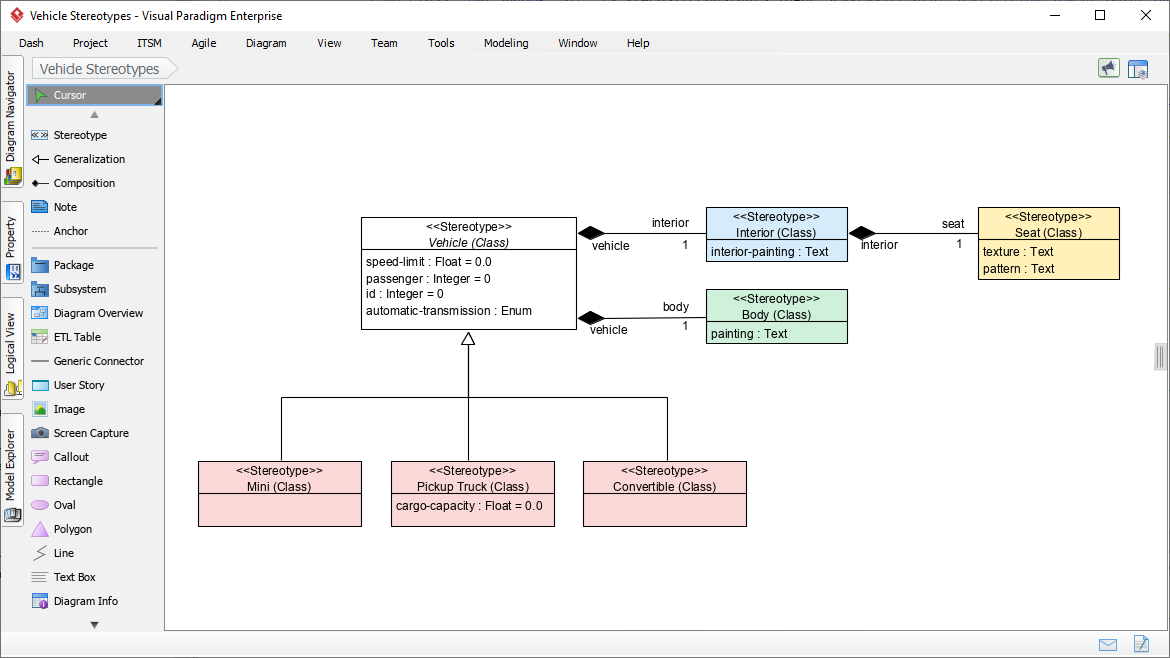
In the world of systems modeling, standard UML elements like Classes and Interfaces are powerful, but they often lack the domain-specific nuance required for complex enterprise projects. This is where the Profile Diagram comes into play. As demonstrated in the provided screenshot from Visual Paradigm, a Profile Diagram is the primary mechanism for defining and visualizing custom Stereotypes. It allows architects to extend the UML language to fit the specific vocabulary and rules of their organization.
This tutorial explores the anatomy of the “Vehicle Stereotypes” diagram shown in the screenshot, explaining how to construct robust, domain-specific modeling languages using the Visual Paradigm toolset.
What is a Profile Diagram?
A Profile Diagram is not a static picture of a system; it is a definition of a modeling language. It serves as the blueprint for creating custom elements that can be reused throughout your entire project. Instead of using a generic “Class” symbol, you can define a “Vehicle” stereotype that comes with pre-defined properties (tags) and visual styling.
As seen in the interface, the “Diagram Navigator” on the left provides the palette of elements required to build this custom language:
- Stereotype: The base element that defines a new type.
- Generalization: The inheritance arrow (hollow triangle) used to create hierarchies.
- Composition: The solid diamond connector used to define ownership.
Analyzing the Vehicle Architecture
The diagram in the screenshot illustrates a sophisticated extension of the UML Class diagram tailored for the automotive domain. It combines structural definitions with inheritance logic.
1. Defining the Base Stereotype
The central element, <<Stereotype>> Vehicle (Class), acts as the root of this domain. By marking it as a stereotype, Visual Paradigm allows us to attach specific metadata to it without cluttering the standard UML model.
Notice the attributes listed inside the box:
speed-limit : Float = 0.0passenger : Integer = 0automatic-transmission : Enum
These are not standard class attributes; they are properties of the stereotype. When a modeler drags a “Vehicle” onto a diagram later, these fields will automatically be available, ensuring consistency across the project.
2. Structuring with Composition
The diagram demonstrates how to define the composition of a vehicle. The relationship between Vehicle and Interior, and Vehicle and Body, is marked with a solid black diamond. In UML, this signifies Composition.
This implies a “part-of” relationship where the lifecycle of the parts (Interior, Body) is strictly dependent on the whole (Vehicle). If the Vehicle is destroyed, the Interior ceases to exist. The cardinality labels (1) further define that a Vehicle has exactly one Interior and exactly one Body in this model.
3. Inheritance and Specialization
The bottom section of the diagram utilizes the Generalization relationship. The empty triangle pointing from Mini, Pickup Truck, and Convertible to Vehicle indicates an “is-a” relationship.
- Pickup Truck: Inherits all properties of Vehicle but adds
cargo-capacity. - Mini / Convertible: These specialized types inherit the core definition but might differ in visual rendering or specific constraints.
Step-by-Step Construction in Visual Paradigm
To recreate this domain-specific profile, follow this logical workflow within the Visual Paradigm interface:
- Create the Profile: Right-click in the project tree, select New > Profile, and name it (e.g., “VehicleProfile”).
- Add the Base Class: From the Diagram Navigator, drag a Stereotype element onto the canvas. Double-click it to rename it to “Vehicle” and add the “Class” notation.
- Define Attributes: Open the properties of the Stereotype and add the tags such as
speed-limitandpassengerwith their respective data types (Float, Integer). - Establish Relationships: Select the Composition tool. Draw a line from the Vehicle stereotype to a new Stereotype element named “Interior”. Ensure the relationship is marked with the Composition symbol (diamond).
- Build the Hierarchy: Create new stereotypes for “Mini” and “Pickup Truck”. Use the Generalization tool to connect them to the “Vehicle” stereotype.
Why Use Profile Diagrams?
The ultimate value of a Profile Diagram is standardization. By defining a “Vehicle” stereotype once, every modeler in the team can use it. This ensures that:
- Consistency: Every vehicle definition contains the required fields (speed, passengers).
- Clarity: The diagram clearly distinguishes between a standard software class and a domain-specific concept.
- Extensibility: As the domain evolves (e.g., adding “Electric Vehicle”), you simply add a new subclass in the profile diagram without breaking existing models.
By mastering the Profile Diagram, you move from simply drawing diagrams to engineering a modeling language that perfectly fits your project’s needs.