
Mastering UML Activity Diagrams: Modeling Complex Workflows with AI
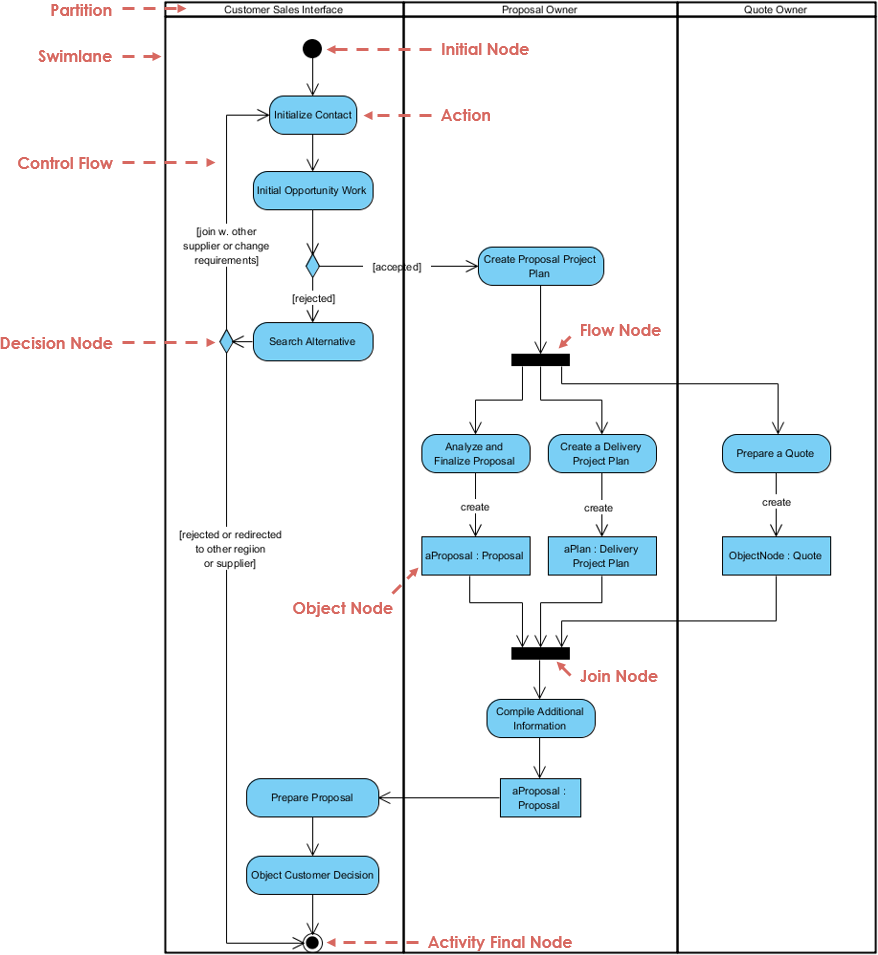
In the world of software engineering and business analysis, visualizing how a process moves from start to finish is crucial. Activity Diagrams are the industry standard for depicting these step-by-step processes. Often referred to as the “flowcharts of UML,” they offer a powerful way to model business workflows, algorithms, and complex system logic.
This tutorial will walk you through the anatomy of an Activity Diagram, using a real-world scenario—a Customer Sales and Proposal workflow—to demonstrate how to map out the flow of control, manage data, and coordinate parallel tasks.
Understanding the Core Structure: Partitions and Swimlanes
The most defining characteristic of an Activity Diagram is its ability to organize activities by who or what is responsible for them. This is achieved using Partitions, visually represented as vertical columns.
- Swimlanes: These vertical divisions represent different roles, departments, or system components (e.g., “Customer Sales Interface,” “Proposal Owner,” “Quote Owner”).
- Ownership: Placing an activity inside a specific lane clarifies responsibility. If a step is in the “Proposal Owner” lane, it is clear that the sales representative handles that task, not the customer.
By organizing your diagram into swimlanes, you eliminate ambiguity regarding process ownership and make the interaction between different stakeholders immediately visible.
The Anatomy of a Process Flow
Let’s break down the mechanics of the diagram using the “Customer Sales” example. An activity diagram is not just a list of steps; it is a dynamic model of execution.
1. The Lifecycle of an Activity
Every process must have a clear beginning and end. In UML, these are represented by specific nodes:
- Initial Node: The solid black circle that signifies the start of the workflow. The flow begins here and moves downward.
- Activity Final Node: The black circle with a surrounding ring, indicating the successful completion of the process.
- Actions: These are the rounded rectangles (e.g., “Initialize Contact,” “Create Proposal Project Plan”) representing specific work being performed.
2. Decision and Logic Points
Real-world processes are rarely linear. They involve choices. This is where Decision Nodes (represented by diamonds) come into play.
Consider the “Initial Opportunity Work” step. The diagram shows a decision diamond immediately following it. This diamond acts as a fork in the road:
- If the condition
[accepted]is met, the flow moves to the Proposal Owner to create a plan. - If the condition
[rejected]is met, the flow stays in the Customer Sales Interface to “Search Alternative.”
This visual logic allows developers and analysts to instantly see the “happy path” versus the error handling or alternative scenarios.
3. Handling Parallelism: Fork and Join Nodes
One of the most powerful features of Activity Diagrams is the ability to show concurrency. In our example, once the “Create Proposal Project Plan” is approved, the process splits into multiple parallel tracks.
We see this via the Fork Node (a thick black bar):
- Track A: Analyze and Finalize Proposal.
- Track B: Create a Delivery Project Plan.
- Track C: Prepare a Quote.
These three activities happen simultaneously. To bring them back together, we use a Join Node (another thick black bar). The process cannot proceed to “Compile Additional Information” until all incoming paths (A, B, and C) have completed. This ensures data consistency before the next major step.
Managing State: Object Nodes
While actions change the state of a system, Object Nodes represent the data itself. In the diagram, you will see blue rectangles labeled “aProposal : Proposal” or “ObjectNode : Quote.”
These nodes visualize the flow of data objects. For instance, the “Analyze and Finalize Proposal” action produces a “Proposal” object, which is then passed down to be compiled. Understanding where data is created, modified, and consumed is essential for defining system architecture.
Why Visual Paradigm + AI is the Future of Modeling
Creating complex diagrams like the one above traditionally requires significant manual effort. However, the integration of Visual Paradigm with AI capabilities has revolutionized the modeling process.
Seamless Integration & Collaboration:
- Generative Modeling: Instead of drawing every node manually, teams can now use AI to generate entire activity diagrams from natural language requirements (e.g., “Create a flow for an online order process”).
- Intelligent Suggestions: As you model, AI tools can suggest optimizations, such as identifying dead ends or suggesting parallel processes that were missed.
- Real-time Sync: The tooling ensures that the diagram remains synchronized with the codebase. If the logic changes in the code, the diagram updates, ensuring the “single source of truth” remains intact.
This synergy significantly boosts team productivity by reducing the time spent on documentation and allowing engineers to focus on solving complex architectural problems rather than drawing boxes.
Conclusion
Activity Diagrams are more than just pretty pictures; they are rigorous technical specifications for system behavior. By mastering the use of swimlanes, decision points, and parallel flows, you can create models that are not only easy to understand but also serve as a blueprint for robust software development.