
Modeling Smart City Traffic: An ArchiMate Guide with PlantUML
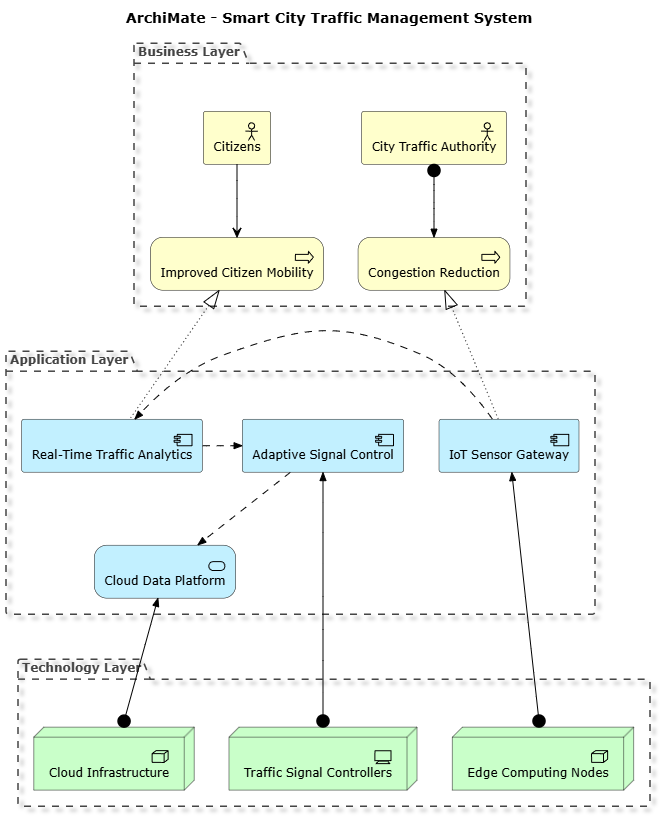
Building intelligent infrastructure requires more than just hardware; it requires a clear architectural blueprint that connects business goals with technical execution. In this tutorial, we will dissect the architecture of a Smart City Traffic Management System, specifically designed for a context like San Francisco. We will explore how to model this complex ecosystem using the ArchiMate modeling language and visualize it efficiently using PlantUML code.
By the end of this guide, you will understand how to map stakeholders to business goals, how application services bridge the gap to technology, and how to write code that renders these architectural diagrams automatically.
1. Defining the Problem Scenario
Before drawing a single box or line, we must define the scope. The City of San Francisco is implementing a system to reduce congestion and improve traffic flow. This is not just a software project; it is a civic improvement initiative.
The system relies on three critical capabilities:
- Data Ingestion: Collecting real-time data from IoT sensors at major intersections.
- Intelligent Processing: Analyzing traffic patterns using AI algorithms.
- Dynamic Control: Optimizing traffic light timings based on current conditions.
To support these capabilities, we must satisfy several functional requirements including citizen engagement via mobile apps, operational oversight for officials, and integration with public transportation systems.
2. The Three-Layer Architecture Approach
ArchiMate organizes architecture into three distinct but interconnected layers. This separation helps us answer the “Why,” “What,” and “How” of our solution.
Layer 1: The Business Layer (The “Why”)
The Business Layer defines the strategic objectives. It connects stakeholders to the goals they want to achieve. In our traffic system, we model:
- Business Actors: The City Traffic Authority, Citizens, Emergency Services, and Public Transit Operators.
- Business Processes: Incident Response, Congestion Reduction, and Improved Citizen Mobility.
- Architecture Goals: High-level outcomes such as “Reduce Congestion” and “Lower Emissions.”
Layer 2: The Application Layer (The “What”)
The Application Layer describes the software services required to support the business processes. It acts as the bridge between business needs and technical infrastructure. Our model includes:
- IoT Sensor Gateway: The entry point for raw data.
- Real-Time Traffic Analytics: The processing engine for pattern recognition.
- Adaptive Signal Control: The logic determining traffic light timings.
- Cloud Data Platform: The central repository (Data Lake) for historical and real-time data.
Layer 3: The Technology Layer (The “How”)
The Technology Layer represents the physical hardware and software that executes the application services. This is the physical reality of the smart city. We model:
- Data Collection (Edge): Roadside cameras, inductive loops, and GPS/Connected Vehicles.
- Network: 5G and network infrastructure connecting edge devices to the cloud.
- Cloud Infrastructure: Servers hosting the AI/ML platforms.
- Traffic Signal Controllers: The physical actuators that change traffic lights.
3. Modeling the System with PlantUML
To visualize this architecture, we utilize the VPasCode plugin for Visual Paradigm. This allows architects to write ArchiMate diagrams using PlantUML syntax, streamlining the design process and allowing for version control of architecture.
The following code snippet demonstrates how to define the core components of the Smart City Traffic Management System using ArchiMate stereotypes. Notice how we use specific stereotypes like BusinessActor, ApplicationComponent, and Technology_Node.
@startuml
!include https://static.visual-paradigm.com/plantuml-stdlib/Archimate-PlantUML/master/Archimate.puml

title ArchiMate - Smart City Traffic Management System

' Define the Business Layer Grouping
Grouping(business_layer, "Business Layer") {
  Business_Actor(citya, "City Traffic Authority")
  Business_Actor(citizens, "Citizens")
  Business_Process(congred, "Congestion Reduction")
  Business_Process(mobimp, "Improved Citizen Mobility")
}

' Define the Application Layer Grouping
Grouping(application_layer, "Application Layer") {
  Application_Component(iotgw, "IoT Sensor Gateway")
  Application_Component(rta, "Real-Time Traffic Analytics")
  Application_Component(sigctrl, "Adaptive Signal Control")
  Application_Service(clouddb, "Cloud Data Platform")
}

' Define the Technology Layer Grouping
Grouping(technology_layer, "Technology Layer") {
  Technology_Node(edge, "Edge Computing Nodes")
  Technology_Node(cloudinfra, "Cloud Infrastructure")
  Technology_Device(sigdev, "Traffic Signal Controllers")
}

' Business Relationships
' Business actors drive / benefit from the business processes
Rel_Assignment(citya, congred, "")
Rel_Serving(citizens, mobimp, "")

' Realization Relationships
' Business processes are realized by the application layer
Rel_Realization_Up(iotgw, congred, "")
Rel_Realization_Up(rta, mobimp, "")

' Application Flow
' Application flow between system components
Rel_Flow_Right(iotgw, rta, "")
Rel_Flow_Right(rta, sigctrl, "")
Rel_Flow_Down(sigctrl, clouddb, "")

' Technology Assignment
' Technology layer is assigned to support the application layer
Rel_Assignment_Up(edge, iotgw, "")
Rel_Assignment_Up(cloudinfra, clouddb, "")
Rel_Assignment_Up(sigdev, sigctrl, "")

@enduml
4. Decoding the Architecture Diagram
When the code above is rendered, it produces a layered diagram that clearly communicates the system’s structure. Let’s break down the key relationships visualized:
Top-Down Flow
The diagram demonstrates a clear flow from the abstract to the concrete:
- Business to Application: The “City Traffic Authority” is assigned to the “Congestion Reduction” process. This process is then realized by the “IoT Sensor Gateway.” This tells us that to reduce congestion, we need an IoT gateway.
- Application to Technology: The “IoT Sensor Gateway” (Application) is assigned to “Edge Computing Nodes” (Technology). This signifies that the software component runs on physical edge hardware.
Horizontal Data Flow
Within the Application Layer, the diagram shows data moving from the IoT Sensor Gateway to Real-Time Traffic Analytics, and finally to Adaptive Signal Control. This visualizes the pipeline of data processing required to make a traffic decision.
Conclusion
By using ArchiMate and PlantUML, we have created a living document of the Smart City Traffic Management System. This approach ensures that the technical implementation (the code and hardware) remains aligned with the business objectives (reducing congestion and improving mobility). Whether you are a stakeholder or a developer, this layered view provides the clarity necessary to build complex, resilient systems.