Introduction
In today’s complex business landscape, operational efficiency and cross-departmental alignment are critical for success. Business Process Model and Notation (BPMN) 2.0 has emerged as the global standard for visually mapping business processes. It provides a common, intuitive language that bridges the gap between business analysts who design workflows, technical developers who implement them, and operational staff who execute them.
By translating abstract procedures into standardized visual diagrams, BPMN eliminates ambiguity, highlights bottlenecks, and ensures every stakeholder understands their role in the bigger picture. This guide breaks down the core components of BPMN 2.0 and demonstrates how they work together using a practical, end-to-end custom product manufacturing workflow.
Key Concepts & Examples
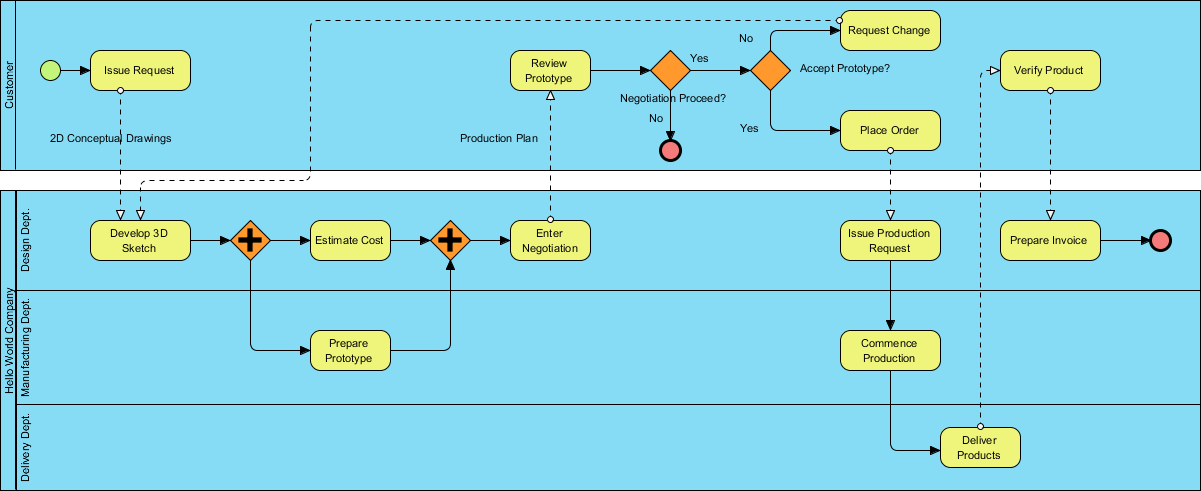
To read and create BPMN diagrams effectively, you must understand its foundational building blocks. Below are the essential elements, illustrated with examples from a custom product request workflow between a Customer and Hello World Company.
1. Pools and Swimlanes (Organizational Structure)
-
Concept: Pools represent major participants in a process (usually distinct organizations or systems). Swimlanes subdivide a pool into specific departments, roles, or teams, clarifying who is responsible for which tasks.
-
Example:
-
Pool 1: Customer (handles requests, reviews, and approvals).
-
Pool 2: Hello World Company, subdivided into three swimlanes: Design Dept., Manufacturing Dept., and Delivery Dept.
-
2. Events (Process Triggers and Outcomes)
-
Concept: Events are circular icons that indicate something that “happens” during the process. They dictate when a process starts, changes state, or ends.
-
Examples:
-
Start Event (Thin green circle): Initiates the workflow. Example: The customer triggers the process by issuing a request.
-
End Event (Thick red circle): Marks the termination of a process path. Example: The workflow ends either when a negotiation fails (early termination) or when an invoice is successfully prepared (successful completion).
-
3. Tasks / Activities (Actionable Steps)
-
Concept: Represented by yellow rounded rectangles, tasks are the specific units of work performed by a person, system, or department to advance the process.
-
Examples: Develop 3D Sketch, Estimate Cost, Prepare Prototype, Commence Production, and Verify Product.
4. Gateways (Decision Points and Flow Control)
-
Concept: Diamond-shaped icons that control how sequence flows diverge (split) or converge (merge). They dictate the routing logic of the process.
-
Examples:
-
Parallel Gateway (
+symbol): Splits the process into multiple concurrent paths that run simultaneously, or synchronizes them back together. Example: After the 3D sketch is developed, the workflow splits so the Design Dept. can Estimate Cost at the exact same time the Manufacturing Dept. begins to Prepare Prototype. -
Exclusive Gateway (Blank diamond): Represents a strict “either/or” decision point where only one path is taken based on a condition. Example: “Accept Prototype?” If Yes, the customer places an order. If No, the customer requests changes, looping the process back to the design phase.
-
5. Flows (Connectors)
-
Concept: Lines that connect flow objects (events, tasks, gateways) to show the progression and communication within the diagram.
-
Examples:
-
Sequence Flow (Solid arrows): Shows the chronological order of tasks within the same pool or swimlane.
-
Message Flow (Dashed arrows with open circles/arrowheads): Represents the exchange of information, documents, or signals between different pools. Example: The customer sends 2D Conceptual Drawings to the Design Dept., and the Design Dept. sends a Production Plan back to the customer for review.
-
Putting It All Together: The Workflow in Action
Understanding these concepts becomes effortless when applied to a real-world scenario. Here is how the elements above orchestrate a complete custom product lifecycle:
-
Initiation: The Customer starts the process (Start Event) by issuing a request and sending conceptual drawings (Message Flow) to the Design Dept.
-
Concurrent Development: The Design Dept. creates a 3D sketch, triggering a Parallel Gateway that allows cost estimation and physical prototyping to happen simultaneously, saving valuable time.
-
Negotiation & Iteration: Once both parallel tasks finish, they merge at a second Parallel Gateway. The company enters negotiations and shares a production plan. The customer reviews it and hits an Exclusive Gateway: if they reject the prototype, a Message Flow loops the request back to the Design Dept. for revisions; if approved, they place an order.
-
Execution: The order triggers internal handoffs via Sequence Flows: Design issues the production request $\rightarrow$ Manufacturing commences production $\rightarrow$ Delivery ships the product.
-
Closure: The customer verifies the delivered product (Message Flow), prompting the Design Dept. to prepare the final invoice, leading to the successful End Event.
Conclusion
BPMN 2.0 is far more than a diagramming tool; it is a strategic asset for business process management. By standardizing how workflows are visualized, organizations can eliminate silos, reduce miscommunication, and identify inefficiencies—such as unnecessary delays or redundant approval steps—before they impact the bottom line.
As demonstrated by the custom product workflow, mastering BPMN elements like pools, gateways, and message flows empowers teams to design agile, transparent, and highly coordinated operations. Whether you are optimizing a simple internal approval chain or mapping a complex, multi-departmental supply chain, BPMN provides the clarity needed to turn business strategy into executable, measurable action.
